Starbucks 2012 Annual Report Download - page 9
Download and view the complete annual report
Please find page 9 of the 2012 Starbucks annual report below. You can navigate through the pages in the report by either clicking on the pages listed below, or by using the keyword search tool below to find specific information within the annual report.-
 1
1 -
 2
2 -
 3
3 -
 4
4 -
 5
5 -
 6
6 -
 7
7 -
 8
8 -
 9
9 -
 10
10 -
 11
11 -
 12
12 -
 13
13 -
 14
14 -
 15
15 -
 16
16 -
 17
17 -
 18
18 -
 19
19 -
 20
20 -
21
-
22
-
23
-
24
-
25
-
26
-
27
-
28
-
29
-
30
-
31
-
32
-
33
-
34
-
35
-
36
-
37
-
38
-
39
-
40
-
41
-
42
-
43
-
44
-
45
-
46
-
47
-
48
-
49
-
50
-
51
-
52
-
53
-
54
-
55
-
56
-
57
-
58
-
59
-
60
-
61
-
62
-
63
-
64
-
65
-
66
-
67
-
68
-
69
-
70
-
71
-
72
-
73
-
74
-
75
-
76
-
77
-
78
-
79
-
80
-
81
-
82
-
83
-
84
-
85
-
86
-
87
-
88
-
89
-
90
-
91
-
92
-
93
-
94
-
95
-
96
-
97
-
98
-
99
-
100
-
101
-
102
-
103
-
104
-
105
-
106
-
107
-
108
-
109
-
110
 |
 |

3
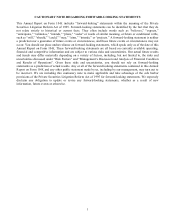
Our Channel Development segment includes whole bean and ground coffees, premium Tazo® teas, Starbucks
VIA® Ready Brew, Starbucks®coffee and Tazo®tea K-Cup®portion packs, a variety of ready-to-drink
beverages, such as Starbucks Refreshers™ beverages, and other branded products sold worldwide through
channels such as grocery stores, warehouse clubs, convenience stores, and US foodservice accounts.
Seattle’s Best Coffee is reported in “Other” along with Evolution Fresh, Digital Ventures and unallocated
corporate expenses that pertain to corporate administrative functions that support our operating segments but are
not specifically attributable to or managed by any segment and are not included in the reported financial results
of the operating segments. The Other category comprised approximately 1% of total net revenues.
Financial information for Starbucks reportable operating segments and Other is included in Note 17 to the
consolidated financial statements included in Item 8 of this 10-K.
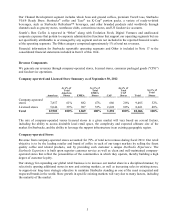
Revenue Components
We generate our revenues through company-operated stores, licensed stores, consumer packaged goods ("CPG")
and foodservice operations.
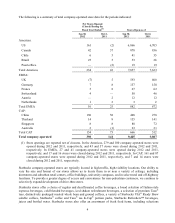
Company-operated and Licensed Store Summary as of September 30, 2012
Americas
As a% of
Total
Americas
Stores EMEA
As a% of
Total
EMEA
Stores CAP
As a% of
Total
CAP
Stores Total
As a% of
Total
Stores
Company-operated
stores 7,857 61% 882 47% 666 20% 9,405 52%
Licensed stores 5,046 39% 987 53% 2,628 80% 8,661 48%
Total 12,903 100% 1,869 100% 3,294 100% 18,066 100%
The mix of company-operated versus licensed stores in a given market will vary based on several factors,
including the ability to access desirable local retail space, the complexity and expected ultimate size of the
market for Starbucks, and the ability to leverage the support infrastructure in an existing geographic region.
Company-operated Stores
Revenue from company-operated stores accounted for 79% of total net revenues during fiscal 2012. Our retail
objective is to be the leading retailer and brand of coffee in each of our target markets by selling the finest
quality coffee and related products, and by providing each customer a unique Starbucks Experience. The
Starbucks Experience is built upon superior customer service as well as clean and well-maintained company-
operated stores that reflect the personalities of the communities in which they operate, thereby building a high
degree of customer loyalty.
Our strategy for expanding our global retail business is to increase our market share in a disciplined manner, by
selectively opening additional stores in new and existing markets, as well as increasing sales in existing stores,
to support our long-term strategic objective to maintain Starbucks standing as one of the most recognized and
respected brands in the world. Store growth in specific existing markets will vary due to many factors, including
the maturity of the market.