Starbucks 2012 Annual Report Download - page 32
Download and view the complete annual report
Please find page 32 of the 2012 Starbucks annual report below. You can navigate through the pages in the report by either clicking on the pages listed below, or by using the keyword search tool below to find specific information within the annual report.-
 1
1 -
2
-
3
-
4
-
5
-
6
-
7
-
8
-
9
-
10
-
11
-
12
-
13
-
14
-
15
-
16
-
17
-
18
-
19
-
20
-
21
-
 22
22 -
 23
23 -
 24
24 -
 25
25 -
 26
26 -
 27
27 -
 28
28 -
 29
29 -
 30
30 -
 31
31 -
 32
32 -
 33
33 -
 34
34 -
 35
35 -
 36
36 -
 37
37 -
 38
38 -
 39
39 -
 40
40 -
 41
41 -
 42
42 -
43
-
44
-
45
-
46
-
47
-
48
-
49
-
50
-
51
-
52
-
53
-
54
-
55
-
56
-
57
-
58
-
59
-
60
-
61
-
62
-
63
-
64
-
65
-
66
-
67
-
68
-
69
-
70
-
71
-
72
-
73
-
74
-
75
-
76
-
77
-
78
-
79
-
80
-
81
-
82
-
83
-
84
-
85
-
86
-
87
-
88
-
89
-
90
-
91
-
92
-
93
-
94
-
95
-
96
-
97
-
98
-
99
-
100
-
101
-
102
-
103
-
104
-
105
-
106
-
107
-
108
-
109
-
110
 |
 |
26
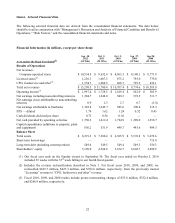
EMEA segment results reflect both the investments we have begun making as part of our transformation plan for
the region, as well as the macro-economic headwinds we, and others, face there. This resulted in flat comparable
store sales and operating income of $10 million for fiscal 2012, a decrease of $30 million compared to fiscal 2011.
We started the year by putting in place a new leadership team that is focused on increasing the Starbucks brand
presence, health and relevancy across the region, improving the profitability of the existing store base through a
focus on revenue growth and operating costs, and identifying opportunities for new store growth through licensing
arrangements. We expect the investments we are making as part of this transformation effort will result in
improved operating performance as we progress on our plan towards mid-teens operating margin; however, this
turnaround will take time to gain traction.
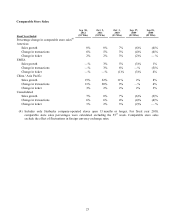
CAP segment revenues increased 31%, driven by new store growth and comparable store sales of 15%. This
segment continues to grow rapidly and is becoming a more meaningful contributor to overall company
profitability. We expect continued growth will be from a mix of new store openings and comparable store sales
growth. China continues to be a significant growth opportunity for us as we remain on track to reach our goal of
1,500 stores in 2015. In addition, other key markets such as Japan, Korea, Thailand, Singapore and Indonesia all
continue to be profitable and provide a solid foundation for continued growth in the region.
Our Channel Development segment represents another important, profitable growth opportunity for us. Channel
Development results were a solid contributor to overall revenue growth with a 50% increase in revenues primarily
due to sales of Starbucks and Tazo branded K-Cup® portion packs which launched at the start of fiscal 2012 and
our transition to a direct distribution model for packaged coffee, which occurred during the second quarter of
fiscal 2011. High commodity costs continued to be a significant drag on operating margin; however, despite these
higher costs, operating income increased $61 million to $349 million for fiscal 2012. We expect continued
innovation and new product offerings such as the Verismo™ system by Starbucks and Starbucks Refreshers™
beverages will drive further growth and profitability within this segment over time.
Fiscal 2013 — The View Ahead
For fiscal year 2013, we expect moderate revenue growth driven by mid single-digit increased comparable store
sales, new store openings and strong growth in the Channel Development business. Licensed stores will comprise
between one-half and two-thirds of new store openings.
We expect continued robust consolidated operating margin and EPS improvement compared to fiscal 2012,
reflecting the strength of our global business and the pipeline of profitable growth initiatives.
We expect increased capital expenditures in fiscal 2013 compared to fiscal 2012, reflecting additional investments
in store renovations, new store growth and manufacturing capacity.
Operating Segment Overview
Starbucks has four reportable operating segments: Americas, Europe, Middle East, and Africa ("EMEA"), China
and Asia Pacific ("CAP") and Channel Development. Seattle’s Best Coffee is reported in “Other,” along with
Evolution Fresh, Digital Ventures and unallocated corporate expenses that pertain to corporate administrative
functions that support our operating segments but are not specifically attributable to or managed by any segment
and are not included in the reported financial results of the operating segments.
The Americas, EMEA and CAP segments include company-operated stores and licensed stores. Licensed stores
generally have a higher operating margin than company-operated stores. Under the licensed model, Starbucks
receives a reduced share of the total store revenues, but this is more than offset by the reduction in its share of
costs as these are primarily incurred by the licensee. The EMEA and CAP segments have a higher relative share of
licensed stores versus company-operated stores compared to the Americas segment; however, the Americas
segment has been operating significantly longer than the other segments and has developed deeper awareness of,
and attachment to, the Starbucks brand and stores among its customer base. As a result, the more mature Americas
segment has significantly more stores and higher total revenues than the other segments. Average sales per store
are also higher in the Americas due to various factors including length of time in market and local income levels.