Windstream 2009 Annual Report Download - page 121
Download and view the complete annual report
Please find page 121 of the 2009 Windstream annual report below. You can navigate through the pages in the report by either clicking on the pages listed below, or by using the keyword search tool below to find specific information within the annual report.-
 1
1 -
2
-
3
-
4
-
5
-
6
-
7
-
8
-
9
-
10
-
11
-
12
-
13
-
14
-
15
-
16
-
17
-
18
-
19
-
20
-
21
-
22
-
23
-
24
-
25
-
26
-
27
-
28
-
29
-
30
-
31
-
32
-
33
-
34
-
35
-
36
-
37
-
38
-
39
-
40
-
41
-
42
-
43
-
44
-
45
-
46
-
47
-
48
-
49
-
50
-
51
-
52
-
53
-
54
-
55
-
56
-
57
-
58
-
59
-
60
-
61
-
62
-
63
-
64
-
65
-
66
-
67
-
68
-
69
-
70
-
71
-
72
-
73
-
74
-
75
-
76
-
77
-
78
-
79
-
80
-
81
-
82
-
83
-
84
-
85
-
86
-
87
-
88
-
89
-
90
-
91
-
92
-
93
-
94
-
95
-
96
-
97
-
98
-
99
-
100
-
101
-
102
-
103
-
104
-
105
-
106
-
107
-
108
-
109
-
110
-
 111
111 -
 112
112 -
 113
113 -
 114
114 -
 115
115 -
 116
116 -
 117
117 -
 118
118 -
 119
119 -
 120
120 -
 121
121 -
 122
122 -
 123
123 -
 124
124 -
 125
125 -
 126
126 -
 127
127 -
 128
128 -
 129
129 -
 130
130 -
 131
131 -
132
-
133
-
134
-
135
-
136
-
137
-
138
-
139
-
140
-
141
-
142
-
143
-
144
-
145
-
146
-
147
-
148
-
149
-
150
-
151
-
152
-
153
-
154
-
155
-
156
-
157
-
158
-
159
-
160
-
161
-
162
-
163
-
164
-
165
-
166
-
167
-
168
-
169
-
170
-
171
-
172
-
173
-
174
-
175
-
176
-
177
-
178
-
179
-
180
-
181
-
182
-
183
-
184
-
185
-
186
-
187
-
188
-
189
-
190
-
191
-
192
-
193
-
194
-
195
-
196
 |
 |

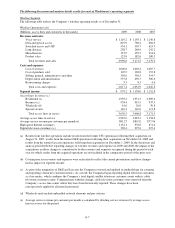
The following discussion and analysis details results for each of Windstream’s operating segments
Wireline Segment
The following table reflects the Company’s wireline operating results as of December 31:
Wireline Operations (a,b)
(Millions, access lines and customers in thousands) 2009 2008 2007
Revenues and sales:
Voice service $ 1,116.2 $ 1,195.1 $ 1,246.8
Data and special access 825.9 768.2 682.6
Switched access and USF 534.1 599.7 613.7
Long distance 258.7 266.6 242.2
Miscellaneous 137.9 159.3 214.0
Product sales 123.8 182.6 180.3
Total revenues and sales 2,996.6 3,171.5 3,179.6
Costs and expenses:
Cost of services 1,006.8 1,005.4 1,007.7
Cost of products sold 107.5 169.8 153.8
Selling, general, administrative and other 356.0 356.5 354.7
Depreciation and amortization 537.8 492.7 506.0
Restructuring charges 9.3 8.5 4.6
Total costs and expenses 2,017.4 2,032.9 2,026.8
Segment income $ 979.2 $ 1,138.6 $ 1,152.8
Access lines in service (c)
Residential (c) 1,959.4 1,951.3 2,089.4
Business (c) 938.4 919.5 937.3
Wholesale (d) 16.6 20.0 30.8
Special circuits 116.1 116.0 113.8
Total access lines in service 3,030.5 3,006.8 3,171.3
Average access lines in service 2,945.6 3,093.2 3,158.0
Average service revenue per customer per month (e) $81.27 $80.52 $77.96
High-speed Internet customers 1,132.1 978.8 871.4
Digital television customers (c) 369.4 297.0 227.4
(a) Results from wireline operations include results from the former CTC operations following their acquisition on
August 31, 2007, results from the former D&E operations following their acquisition on November 10, 2009 and
results from the former Lexcom operations following their acquisition on December 1, 2009. In the discussion and
analysis provided below regarding changes in wireline revenues and expenses in 2009 and 2008, the impact of the
acquisitions on these changes is considered to be the revenues and expenses recognized during the period of each
year for which results from the acquired operations are not included in the comparative period of the prior year.
(b) Certain prior year revenues and expenses were reclassified to reflect the current presentation and these changes
had no impact on segment income.
(c) As part of the integration of D&E and Lexcom, the Company reviewed and updated its methodology for counting
and reporting certain key customer metrics. As a result, the Company began reporting digital television customers
as a key metric, which combines the Company’s total digital satellite television customer counts with its cable
television customer counts. Commensurate with this change, cable television customers were removed from the
Company’s access line counts where they have been historically reported. These changes have been
retrospectively applied to all periods presented.
(d) Wholesale units include unbundled network elements and pay stations.
(e) Average service revenue per customer per month is calculated by dividing service revenues by average access
lines in service for the period.
F-7