Windstream 2009 Annual Report Download - page 144
Download and view the complete annual report
Please find page 144 of the 2009 Windstream annual report below. You can navigate through the pages in the report by either clicking on the pages listed below, or by using the keyword search tool below to find specific information within the annual report.-
 1
1 -
2
-
3
-
4
-
5
-
6
-
7
-
8
-
9
-
10
-
11
-
12
-
13
-
14
-
15
-
16
-
17
-
18
-
19
-
20
-
21
-
22
-
23
-
24
-
25
-
26
-
27
-
28
-
29
-
30
-
31
-
32
-
33
-
34
-
35
-
36
-
37
-
38
-
39
-
40
-
41
-
42
-
43
-
44
-
45
-
46
-
47
-
48
-
49
-
50
-
51
-
52
-
53
-
54
-
55
-
56
-
57
-
58
-
59
-
60
-
61
-
62
-
63
-
64
-
65
-
66
-
67
-
68
-
69
-
70
-
71
-
72
-
73
-
74
-
75
-
76
-
77
-
78
-
79
-
80
-
81
-
82
-
83
-
84
-
85
-
86
-
87
-
88
-
89
-
90
-
91
-
92
-
93
-
94
-
95
-
96
-
97
-
98
-
99
-
100
-
101
-
102
-
103
-
104
-
105
-
106
-
107
-
108
-
109
-
110
-
111
-
112
-
113
-
114
-
115
-
116
-
117
-
118
-
119
-
120
-
121
-
122
-
123
-
124
-
125
-
126
-
127
-
128
-
129
-
130
-
131
-
132
-
133
-
 134
134 -
 135
135 -
 136
136 -
 137
137 -
 138
138 -
 139
139 -
 140
140 -
 141
141 -
 142
142 -
 143
143 -
 144
144 -
 145
145 -
 146
146 -
 147
147 -
 148
148 -
 149
149 -
 150
150 -
 151
151 -
 152
152 -
 153
153 -
 154
154 -
155
-
156
-
157
-
158
-
159
-
160
-
161
-
162
-
163
-
164
-
165
-
166
-
167
-
168
-
169
-
170
-
171
-
172
-
173
-
174
-
175
-
176
-
177
-
178
-
179
-
180
-
181
-
182
-
183
-
184
-
185
-
186
-
187
-
188
-
189
-
190
-
191
-
192
-
193
-
194
-
195
-
196
 |
 |

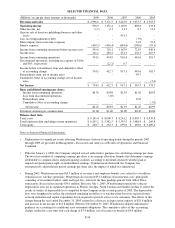
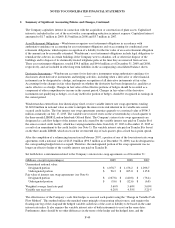
SELECTED FINANCIAL DATA
(Millions, except per share amounts in thousands) 2009 2008 2007 2006 2005
Revenues and sales $ 2,996.6 $ 3,171.5 $ 3,245.9 $ 3,033.3 $ 2,923.5
Operating income 956.9 1,132.4 1,149.9 898.8 633.8
Other income, net (1.1) 2.1 11.1 8.7 11.6
Gain on sale of directory publishing business and other
assets - - 451.3 - -
Loss on extinguishment of debt - - - (7.9) -
Intercompany interest income (expense) - - - 31.9 23.3
Interest expense (410.2) (416.4) (444.4) (209.6) (19.1)
Income from continuing operations before income taxes 545.6 718.1 1,167.9 721.9 649.6
Income taxes 211.1 283.2 251.5 276.3 267.9
Income from continuing operations 334.5 434.9 916.4 445.6 381.7
Discontinued operations, including tax expense of $10.6
and $0.5, respectively - (22.2) 0.7 - -
Income before extraordinary item and cumulative effect
of accounting change 334.5 412.7 917.1 445.6 381.7
Extraordinary item, net of income taxes - - - 99.7 -
Cumulative effect of accounting change, net of income
taxes ----(7.4)
Net Income $ 334.5 $ 412.7 $ 917.1 $ 545.3 $ 374.3
Basic and diluted earnings per share:
Income from continuing operations $0.76 $0.98 $1.93 $1.02 $0.95
Loss from discontinued operations - (.05) - - -
Extraordinary item - - - 0.23 -
Cumulative effect of accounting change ----(.02)
Net income $0.76 $0.93 $1.93 $1.25 $0.93
Dividends declared per common share $1.00 $1.00 $1.00 $0.45 $0.00
Balance sheet data
Total assets $ 9,145.4 $ 8,009.3 $ 8,241.2 $ 8,030.7 $ 4,935.8
Total long-term debt (including current maturities) $ 6,295.2 $ 5,382.5 $ 5,355.5 $ 5,488.4 $ 260.8
Total equity $ 260.7 $ 252.3 $ 699.8 $ 469.8 $ 3,489.2
Notes to Selected Financial Information:
• Explanations for significant events affecting Windstream’s historical operating trends during the periods 2007
through 2009 are provided in Management’s Discussion and Analysis of Results of Operations and Financial
Condition.
• Effective January 1, 2009, the Company adopted revised authoritative guidance for calculating earnings per share.
The two-class method of computing earnings per share is an earnings allocation formula that determines earnings
attributable to common shares and participating securities according to dividends declared (whether paid or
unpaid) and participation rights in undistributed earnings. Commensurate therewith, the Company has
retrospectively adjusted prior period earnings per share data, the impact of which was immaterial.
• During 2005, Windstream incurred $4.5 million of severance and employee benefit costs related to a workforce
reduction in its wireline operations. Windstream also incurred $31.2 million of incremental costs, principally
consisting of investment banker, audit and legal fees, related to the then pending spin off from Alltel. These
transactions decreased net income $34.1 million. Effective July 1, 2005, Windstream prospectively reduced
depreciation rates for its regulated operations in Florida, Georgia, North Carolina and South Carolina to reflect the
results of studies of depreciable lives completed by the Company in the second quarter of 2005. The depreciable
lives were lengthened to reflect the estimated remaining useful lives of wireline plant based on expected future
network utilization and capital expenditure levels required to provide service to its customers. The effects of this
change during the year ended December 31, 2005 resulted in a decrease in depreciation expense of $21.8 million
and increase in net income of $12.8 million. Effective December 31, 2005, Windstream adopted authoritative
guidance on accounting for conditional asset retirement obligations. The cumulative effect of this accounting
change resulted in a one-time non-cash charge of $7.4 million, net of income tax benefit of $4.6 million.
F-30