Windstream 2009 Annual Report Download - page 123
Download and view the complete annual report
Please find page 123 of the 2009 Windstream annual report below. You can navigate through the pages in the report by either clicking on the pages listed below, or by using the keyword search tool below to find specific information within the annual report.-
 1
1 -
2
-
3
-
4
-
5
-
6
-
7
-
8
-
9
-
10
-
11
-
12
-
13
-
14
-
15
-
16
-
17
-
18
-
19
-
20
-
21
-
22
-
23
-
24
-
25
-
26
-
27
-
28
-
29
-
30
-
31
-
32
-
33
-
34
-
35
-
36
-
37
-
38
-
39
-
40
-
41
-
42
-
43
-
44
-
45
-
46
-
47
-
48
-
49
-
50
-
51
-
52
-
53
-
54
-
55
-
56
-
57
-
58
-
59
-
60
-
61
-
62
-
63
-
64
-
65
-
66
-
67
-
68
-
69
-
70
-
71
-
72
-
73
-
74
-
75
-
76
-
77
-
78
-
79
-
80
-
81
-
82
-
83
-
84
-
85
-
86
-
87
-
88
-
89
-
90
-
91
-
92
-
93
-
94
-
95
-
96
-
97
-
98
-
99
-
100
-
101
-
102
-
103
-
104
-
105
-
106
-
107
-
108
-
109
-
110
-
111
-
112
-
 113
113 -
 114
114 -
 115
115 -
 116
116 -
 117
117 -
 118
118 -
 119
119 -
 120
120 -
 121
121 -
 122
122 -
 123
123 -
 124
124 -
 125
125 -
 126
126 -
 127
127 -
 128
128 -
 129
129 -
 130
130 -
 131
131 -
 132
132 -
 133
133 -
134
-
135
-
136
-
137
-
138
-
139
-
140
-
141
-
142
-
143
-
144
-
145
-
146
-
147
-
148
-
149
-
150
-
151
-
152
-
153
-
154
-
155
-
156
-
157
-
158
-
159
-
160
-
161
-
162
-
163
-
164
-
165
-
166
-
167
-
168
-
169
-
170
-
171
-
172
-
173
-
174
-
175
-
176
-
177
-
178
-
179
-
180
-
181
-
182
-
183
-
184
-
185
-
186
-
187
-
188
-
189
-
190
-
191
-
192
-
193
-
194
-
195
-
196
 |
 |

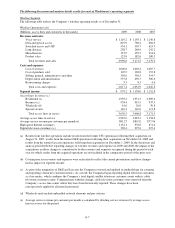
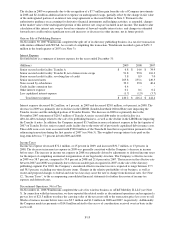
Switched Access and USF Revenues
Switched access and Universal Service Fund (“USF”) revenues include usage sensitive charges to long distance
companies for access to the Company’s network in connection with the completion of interstate and intrastate long
distance calls, as well as receipts from federal and state universal service funds that subsidize the cost of providing
wireline services. The following table reflects the primary drivers of year-over-year changes in switched access and
USF revenues:
Twelve months ended
December 31, 2009
Twelve months ended
December 31, 2008
(Millions)
Increase
(Decrease) %
Increase
(Decrease) %
Due to D&E acquisition $ 3.8 $ -
Due to Lexcom acquisition 1.0 -
Due to CTC acquisition - 16.1
Due to decreases in switched access revenues (a) (44.4) (19.8)
Due to settlement of inter-carrier traffic dispute in 2007 (b) - (13.3)
Due to changes in state USF support (c) (11.6) 13.1
Due to decreases in federal USF support (d) (7.8) (2.5)
Due to decreases in federal USF surcharge revenue (e) (6.6) (7.6)
Total switched access and USF $ (65.6) (11)% $ (14.0) (2)%
(a) Decreases in switched access revenues are predominately due to the decline in minutes of use, which can be
attributed to a decline in access lines and reduced long distance usage. In addition, reductions in switched access
rates implemented July 1, 2008 and July 1, 2009, discussed further below, contributed $4.9 million and $2.6
million to the year-over-year decline in these revenues during 2009 and 2008, respectively.
(b) Decreases in switched access revenues in 2008 were attributable to a favorable settlement in 2007 of an inter-
carrier traffic dispute with another carrier.
(c) Decreases in state USF revenues in 2009 were attributable to declines in access lines and eligible recoverable
costs. Future declines in access lines will result in proportionate declines in state USF support. The increase in
USF support in 2008 is primarily due to unfavorable state USF assessment made against the Company in 2007.
(d) Decreases in federal USF support were due to the conversion to price-cap regulation as further discussed below.
(e) Decreases in federal USF surcharge revenue were primarily due to the elimination of contribution requirements
for high-speed Internet services effective with the conversion to price-cap regulations on July 1, 2008.
The conversion to price-cap regulation on July 1, 2008 resulted in the transition of support received under the interstate
common line support (“ICLS”) program to a fixed monthly dollar amount of support per access line. Historically, that
support was based largely on recoverable costs and network investments. As a result of this change, future receipts
from the program are expected to decline in proportion to future access line losses.
Also as a result of converting to price-cap regulation, the Company initiated a phased reduction of interstate access
rates to achieve an ultimate rate of $0.0065 per minute by 2012. On July 1, 2009, the Company implemented another
phase of rate reductions, bringing its current composite interstate access rate to approximately $0.0090. As a result of
this change, access revenues are expected to decline by approximately $3.5 million over the next twelve months, with
smaller reductions required in subsequent years.
F-9