Windstream 2009 Annual Report Download - page 122
Download and view the complete annual report
Please find page 122 of the 2009 Windstream annual report below. You can navigate through the pages in the report by either clicking on the pages listed below, or by using the keyword search tool below to find specific information within the annual report.-
 1
1 -
2
-
3
-
4
-
5
-
6
-
7
-
8
-
9
-
10
-
11
-
12
-
13
-
14
-
15
-
16
-
17
-
18
-
19
-
20
-
21
-
22
-
23
-
24
-
25
-
26
-
27
-
28
-
29
-
30
-
31
-
32
-
33
-
34
-
35
-
36
-
37
-
38
-
39
-
40
-
41
-
42
-
43
-
44
-
45
-
46
-
47
-
48
-
49
-
50
-
51
-
52
-
53
-
54
-
55
-
56
-
57
-
58
-
59
-
60
-
61
-
62
-
63
-
64
-
65
-
66
-
67
-
68
-
69
-
70
-
71
-
72
-
73
-
74
-
75
-
76
-
77
-
78
-
79
-
80
-
81
-
82
-
83
-
84
-
85
-
86
-
87
-
88
-
89
-
90
-
91
-
92
-
93
-
94
-
95
-
96
-
97
-
98
-
99
-
100
-
101
-
102
-
103
-
104
-
105
-
106
-
107
-
108
-
109
-
110
-
111
-
 112
112 -
 113
113 -
 114
114 -
 115
115 -
 116
116 -
 117
117 -
 118
118 -
 119
119 -
 120
120 -
 121
121 -
 122
122 -
 123
123 -
 124
124 -
 125
125 -
 126
126 -
 127
127 -
 128
128 -
 129
129 -
 130
130 -
 131
131 -
 132
132 -
133
-
134
-
135
-
136
-
137
-
138
-
139
-
140
-
141
-
142
-
143
-
144
-
145
-
146
-
147
-
148
-
149
-
150
-
151
-
152
-
153
-
154
-
155
-
156
-
157
-
158
-
159
-
160
-
161
-
162
-
163
-
164
-
165
-
166
-
167
-
168
-
169
-
170
-
171
-
172
-
173
-
174
-
175
-
176
-
177
-
178
-
179
-
180
-
181
-
182
-
183
-
184
-
185
-
186
-
187
-
188
-
189
-
190
-
191
-
192
-
193
-
194
-
195
-
196
 |
 |

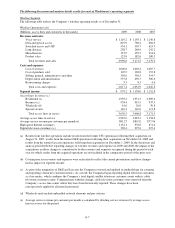
Voice Service Revenues
Voice service revenues consist of traditional telephone services provided to both residential and business customers.
These revenues primarily represent monthly recurring charges for basic services such as local dial-tone and enhanced
services such as caller identification, voicemail and call waiting. The following table reflects the primary drivers of
year-over-year changes in voice service revenues:
Twelve months ended
December 31, 2009
Twelve months ended
December 31, 2008
(Millions)
Increase
(Decrease) %
Increase
(Decrease) %
Due to D&E acquisition $ 6.7 $ -
Due to Lexcom acquisition 0.7 -
Due to CTC acquisition - 40.6
Due to decreases in ala carte calling features (a) (21.2) (20.3)
Due to decreases in local number portability surcharge (b) - (6.0)
Due to access line losses and other (c) (65.1) (66.0)
Total voice service $ (78.9) (7)% $ (51.7) (4)%
(a) Decreases in ala carte features, which includes caller identification, call waiting, call forwarding, voice mail and
other similar services, were attributable to the decline in access lines, customers electing to discontinue these
enhanced services and the impact of discounts on these services when included in product bundles.
(b) Decreases in voice service revenues during 2008 were due, in part, to the expiration in 2007 of a five-year period
during which the Company was allowed to bill customers a surcharge to recover costs associated with local
number portability.
(c) Decreases in access line losses and other during both years are attributable to declines in access lines, as
previously discussed, and the migration of certain customers to Windstream’s Greenstreak voice service.
Greenstreak is a metered voice service, which is priced at a discount as compared to traditional voice services.
Data and Special Access Revenues
Data and special access revenues primarily consist of retail high-speed Internet services, the provision of virtual private
network, virtual LAN and other next generation data services to business customers, and the provision of special access
services to wholesale customers. The following table reflects the primary drivers of year-over-year changes in data and
special access revenues:
Twelve months ended
December 31, 2009
Twelve months ended
December 31, 2008
(Millions)
Increase
(Decrease) %
Increase
(Decrease) %
Due to D&E acquisition $ 6.0 $ -
Due to Lexcom acquisition 0.7 -
Due to CTC acquisition - 22.8
Due to increases in high-speed Internet customers 41.6 46.7
Due to increases in next generation data services (a) 8.3 6.1
Due to increases in special access revenues (b) 6.5 19.9
Due to decreases in mature data services (c) (4.9) (4.0)
Other (0.5) (5.9)
Total data and special access $ 57.7 8% $ 85.6 13%
(a) Increases in next generation data services were attributable to customer demand for these services and geographic
expansion.
(b) Increases in special access revenues, which primarily represent monthly flat-rate charges for dedicated circuits
and virtual networking services, were primarily attributable to demand from wireless and other carriers.
(c) Decreases in mature data services, which primarily include private line and integrated services digital network, or
ISDN, were primarily attributable to customer migration to next generation data services.
F-8