Windstream 2009 Annual Report Download - page 186
Download and view the complete annual report
Please find page 186 of the 2009 Windstream annual report below. You can navigate through the pages in the report by either clicking on the pages listed below, or by using the keyword search tool below to find specific information within the annual report.-
 1
1 -
2
-
3
-
4
-
5
-
6
-
7
-
8
-
9
-
10
-
11
-
12
-
13
-
14
-
15
-
16
-
17
-
18
-
19
-
20
-
21
-
22
-
23
-
24
-
25
-
26
-
27
-
28
-
29
-
30
-
31
-
32
-
33
-
34
-
35
-
36
-
37
-
38
-
39
-
40
-
41
-
42
-
43
-
44
-
45
-
46
-
47
-
48
-
49
-
50
-
51
-
52
-
53
-
54
-
55
-
56
-
57
-
58
-
59
-
60
-
61
-
62
-
63
-
64
-
65
-
66
-
67
-
68
-
69
-
70
-
71
-
72
-
73
-
74
-
75
-
76
-
77
-
78
-
79
-
80
-
81
-
82
-
83
-
84
-
85
-
86
-
87
-
88
-
89
-
90
-
91
-
92
-
93
-
94
-
95
-
96
-
97
-
98
-
99
-
100
-
101
-
102
-
103
-
104
-
105
-
106
-
107
-
108
-
109
-
110
-
111
-
112
-
113
-
114
-
115
-
116
-
117
-
118
-
119
-
120
-
121
-
122
-
123
-
124
-
125
-
126
-
127
-
128
-
129
-
130
-
131
-
132
-
133
-
134
-
135
-
136
-
137
-
138
-
139
-
140
-
141
-
142
-
143
-
144
-
145
-
146
-
147
-
148
-
149
-
150
-
151
-
152
-
153
-
154
-
155
-
156
-
157
-
158
-
159
-
160
-
161
-
162
-
163
-
164
-
165
-
166
-
167
-
168
-
169
-
170
-
171
-
172
-
173
-
174
-
175
-
 176
176 -
 177
177 -
 178
178 -
 179
179 -
 180
180 -
 181
181 -
 182
182 -
 183
183 -
 184
184 -
 185
185 -
 186
186 -
 187
187 -
 188
188 -
 189
189 -
 190
190 -
 191
191 -
 192
192 -
 193
193 -
 194
194 -
 195
195 -
 196
196
 |
 |

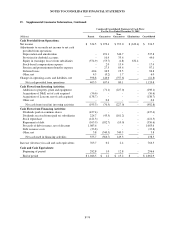
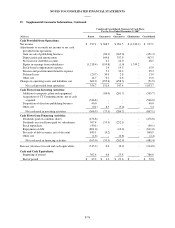
NOTES TO CONSOLIDATED FINANCIAL STATEMENTS
15. Supplemental Guarantor Information, Continued:
Condensed Consolidated Balance Sheet
As of December 31, 2009
(Millions) Parent Guarantors
Non-
Guarantors Eliminations Consolidated
Assets
Current Assets:
Cash and cash equivalents $ 1,046.5 $ 1.2 $ 15.2 $ - $ 1,062.9
Accounts receivable (less allowance for doubtful
accounts of $18.5) 0.2 97.3 199.0 (4.8) 291.7
Inventories - 17.1 9.0 - 26.1
Deferred income taxes 15.6 0.7 5.4 - 21.7
Prepaid expenses and other 19.8 4.8 29.0 - 53.6
Total current assets 1,082.1 121.1 257.6 (4.8) 1,456.0
Investments in consolidated subsidiaries 8,385.3 1,012.2 321.6 (9,719.1) -
Goodwill and other intangibles, net 0.1 2,109.0 1,488.6 - 3,597.7
Net property, plant and equipment 7.6 1,073.5 2,911.5 - 3,992.6
Other assets 60.4 350.5 23.9 (335.7) 99.1
Total Assets $ 9,535.5 $ 4,666.3 $ 5,003.2 $(10,059.6) $ 9,145.4
Liabilities and Shareholders’ Equity
Current Liabilities:
Current maturities of long-term debt $ 13.7 $ - $ 14.9 $ (4.8) $ 23.8
Current portion of interest rate swaps 45.8 - - - 45.8
Accounts payable 9.8 26.5 122.2 - 158.5
Affiliates payable, net 2,735.4 124.6 (2,860.0) - -
Advance payments and customer deposits - 4.5 90.7 - 95.2
Accrued dividends 109.2 - - - 109.2
Accrued taxes (14.3) 26.0 48.9 - 60.6
Accrued interest 153.7 1.7 0.6 - 156.0
Other current liabilities 11.3 6.0 42.9 - 60.2
Total current liabilities 3,064.6 189.3 (2,539.8) (4.8) 709.3
Long-term debt 6,140.7 99.6 366.8 (335.7) 6,271.4
Deferred income taxes (45.9) 635.0 782.9 - 1,372.0
Other liabilities 115.4 15.2 401.4 - 532.0
Total liabilities 9,274.8 939.1 (988.7) (340.5) 8,884.7
Commitments and Contingencies (See Note 13)
Shareholders’ Equity:
Common stock - 41.4 82.4 (123.8) -
Additional paid-in capital 83.6 3,296.8 3,150.4 (6,447.2) 83.6
Accumulated other comprehensive loss (208.3) (2.8) (140.3) 143.1 (208.3)
Retained earnings 385.4 391.8 2,899.4 (3,291.2) 385.4
Total shareholders’ equity 260.7 3,727.2 5,991.9 (9,719.1) 260.7
Total Liabilities and Shareholders’ Equity $ 9,535.5 $ 4,666.3 $ 5,003.2 $(10,059.6) $ 9,145.4
F-72