Windstream 2009 Annual Report Download - page 168
Download and view the complete annual report
Please find page 168 of the 2009 Windstream annual report below. You can navigate through the pages in the report by either clicking on the pages listed below, or by using the keyword search tool below to find specific information within the annual report.-
 1
1 -
2
-
3
-
4
-
5
-
6
-
7
-
8
-
9
-
10
-
11
-
12
-
13
-
14
-
15
-
16
-
17
-
18
-
19
-
20
-
21
-
22
-
23
-
24
-
25
-
26
-
27
-
28
-
29
-
30
-
31
-
32
-
33
-
34
-
35
-
36
-
37
-
38
-
39
-
40
-
41
-
42
-
43
-
44
-
45
-
46
-
47
-
48
-
49
-
50
-
51
-
52
-
53
-
54
-
55
-
56
-
57
-
58
-
59
-
60
-
61
-
62
-
63
-
64
-
65
-
66
-
67
-
68
-
69
-
70
-
71
-
72
-
73
-
74
-
75
-
76
-
77
-
78
-
79
-
80
-
81
-
82
-
83
-
84
-
85
-
86
-
87
-
88
-
89
-
90
-
91
-
92
-
93
-
94
-
95
-
96
-
97
-
98
-
99
-
100
-
101
-
102
-
103
-
104
-
105
-
106
-
107
-
108
-
109
-
110
-
111
-
112
-
113
-
114
-
115
-
116
-
117
-
118
-
119
-
120
-
121
-
122
-
123
-
124
-
125
-
126
-
127
-
128
-
129
-
130
-
131
-
132
-
133
-
134
-
135
-
136
-
137
-
138
-
139
-
140
-
141
-
142
-
143
-
144
-
145
-
146
-
147
-
148
-
149
-
150
-
151
-
152
-
153
-
154
-
155
-
156
-
157
-
 158
158 -
 159
159 -
 160
160 -
 161
161 -
 162
162 -
 163
163 -
 164
164 -
 165
165 -
 166
166 -
 167
167 -
 168
168 -
 169
169 -
 170
170 -
 171
171 -
 172
172 -
 173
173 -
 174
174 -
 175
175 -
 176
176 -
 177
177 -
 178
178 -
179
-
180
-
181
-
182
-
183
-
184
-
185
-
186
-
187
-
188
-
189
-
190
-
191
-
192
-
193
-
194
-
195
-
196
 |
 |

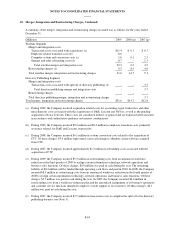
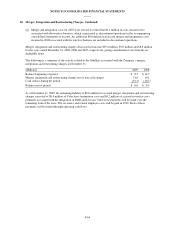
NOTES TO CONSOLIDATED FINANCIAL STATEMENTS
6. Fair Value Measurements:
Windstream utilizes market data or assumptions that market participants would use in valuing its assets and
liabilities, including assumptions about risk and the risks inherent in the inputs to the valuation technique. These
inputs can be readily observable, market corroborated, or generally unobservable. Valuation techniques that
maximize the use of observable inputs and minimize the use of unobservable inputs are used, and the fair value
balances are classified based on the observability of those inputs. The highest priority is given to unadjusted
quoted prices in active markets for identical assets or liabilities (level 1 measurement) and the lowest priority is
given to unobservable inputs (level 3 measurement). Assets and liabilities are classified in their entirety based on
the lowest level of input that is significant to the fair value measurement. The Company’s assessment of the
significance of a particular input to the fair value measurement requires judgment and may affect the valuation of
fair value assets and liabilities and their placement within the fair value hierarchy levels.
The Company’s non-financial assets and liabilities, including goodwill, intangible assets and asset retirement
obligations, are measured at fair value on a non-recurring basis. No event occurred during the year ended
December 31, 2009 requiring these non-financial assets and liabilities to be subsequently recognized at fair value.
The Company’s financial instruments consist primarily of cash and cash equivalents, accounts receivable,
accounts payable, long-term debt and interest rate swaps. The carrying amount of accounts receivable and
accounts payable was estimated by management to approximate fair value due to the relatively short period of
time to maturity for those instruments. Cash equivalents, long-term debt and interest rate swaps are measured at
fair value on a recurring basis.
The fair values of the Company’s cash equivalents and interest rate swaps were determined using the following
inputs at December 31:
2009
Quoted Price
in Active
Markets for
Identical Assets
Significant
Other
Observable
Inputs
Significant
Unobservable
Inputs
(Millions)
Fair
Value
Carrying
Amount Level 1 Level 2 Level 3
Cash equivalents $ 1,062.9 $ 1,062.9 $ 1,062.9 $ - $ -
Interest rate swaps (a) (see
Note 2) $ (117.4) $ (117.4) $ - $ (117.4) $ -
2008
Quoted Price
in Active
Markets for
Identical Assets
Significant
Other
Observable
Inputs
Significant
Unobservable
Inputs
(Millions)
Fair
Value
Carrying
Amount Level 1 Level 2 Level 3
Cash equivalents $ 296.6 $ 296.6 $ 296.6 $ - $ -
Interest rate swaps (a) (see
Note 2) $ (153.4) $ (153.4) $ - $ (153.4) $ -
(a) Included in current portion of interest rate swaps and other liabilities on the consolidated balance sheets as of
December 31, 2009 and 2008, respectively.
The Company’s cash equivalents are primarily highly liquid, actively traded money market funds with next day
access. The fair values of the interest rate swaps were determined based on the present value of expected future
cash flows using LIBOR swap rates which are observable at commonly quoted intervals for the full term of the
swaps, adjusted for the Company’s non-performance risk. As of December 31, 2009 and 2008, the fair value of
the Company’s interest rate swaps were reduced by $5.3 million and $17.4 million, respectively, to reflect the
Company’s non-performance risk. The Company’s non-performance risk is assessed based on the current trading
F-54