Windstream 2009 Annual Report Download - page 174
Download and view the complete annual report
Please find page 174 of the 2009 Windstream annual report below. You can navigate through the pages in the report by either clicking on the pages listed below, or by using the keyword search tool below to find specific information within the annual report.-
 1
1 -
2
-
3
-
4
-
5
-
6
-
7
-
8
-
9
-
10
-
11
-
12
-
13
-
14
-
15
-
16
-
17
-
18
-
19
-
20
-
21
-
22
-
23
-
24
-
25
-
26
-
27
-
28
-
29
-
30
-
31
-
32
-
33
-
34
-
35
-
36
-
37
-
38
-
39
-
40
-
41
-
42
-
43
-
44
-
45
-
46
-
47
-
48
-
49
-
50
-
51
-
52
-
53
-
54
-
55
-
56
-
57
-
58
-
59
-
60
-
61
-
62
-
63
-
64
-
65
-
66
-
67
-
68
-
69
-
70
-
71
-
72
-
73
-
74
-
75
-
76
-
77
-
78
-
79
-
80
-
81
-
82
-
83
-
84
-
85
-
86
-
87
-
88
-
89
-
90
-
91
-
92
-
93
-
94
-
95
-
96
-
97
-
98
-
99
-
100
-
101
-
102
-
103
-
104
-
105
-
106
-
107
-
108
-
109
-
110
-
111
-
112
-
113
-
114
-
115
-
116
-
117
-
118
-
119
-
120
-
121
-
122
-
123
-
124
-
125
-
126
-
127
-
128
-
129
-
130
-
131
-
132
-
133
-
134
-
135
-
136
-
137
-
138
-
139
-
140
-
141
-
142
-
143
-
144
-
145
-
146
-
147
-
148
-
149
-
150
-
151
-
152
-
153
-
154
-
155
-
156
-
157
-
158
-
159
-
160
-
161
-
162
-
163
-
 164
164 -
 165
165 -
 166
166 -
 167
167 -
 168
168 -
 169
169 -
 170
170 -
 171
171 -
 172
172 -
 173
173 -
 174
174 -
 175
175 -
 176
176 -
 177
177 -
 178
178 -
 179
179 -
 180
180 -
 181
181 -
 182
182 -
 183
183 -
 184
184 -
185
-
186
-
187
-
188
-
189
-
190
-
191
-
192
-
193
-
194
-
195
-
196
 |
 |

NOTES TO CONSOLIDATED FINANCIAL STATEMENTS
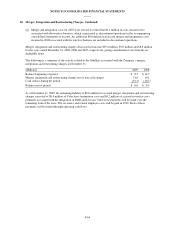
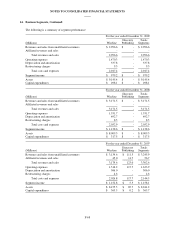
8. Employee Benefit Plans and Postretirement Benefits, Continued:
(a) Changes in the level 3 investments were inconsequential for the year ended December 31, 2009.
(b) Valued at their quoted market price on the last day of the year. Securities traded in markets that are not
considered active are valued based on quoted market prices, broker or dealer quotes or alternative pricing
sources with reasonable levels of price transparency.
(c) Valued by reference to the funds’ underlying assets and are based on the unit values as reported by the fund
manager on the last business day of the year. The underlying assets are mostly comprised of publicly traded
equity securities and fixed income securities. These securities are valued at the official closing price of, or
the last reported sale prices as of the close of business or, in the absence of any sales, at the latest available
bid price.
(d) Based on the value of the underlying contracts adjusted to market value, which recognizes that either long-
term assets would have to be sold before contract maturity or new contributions by other contract holders
would have to be exchanged for funds being transferred, precluding these contributions from being invested
at the current rate of return.
There have been no significant changes in the methodology used to value investments from prior year. The
valuation methods used may produce a fair value calculation that may not be indicative of net realizable value or
reflective of future fair values. Furthermore, although the valuation methods are consistent with other market
participants, the use of different methodologies or assumptions to determine the fair value of certain financial
instruments could result in a different fair value measurement at the reporting date.
Information regarding the healthcare cost trend rate was as follows for the years ended December 31:
2009 2008
Healthcare cost trend rate assumed for next year 9.00% 8.50%
Rate that the cost trend ultimately declines to 5.00% 5.00%
Year that the rate reaches the terminal rate 2016 2014
For the year ended December 31, 2009, a one percent increase in the assumed healthcare cost trend rate would
increase the postretirement benefit cost by approximately $0.2 million, while a one percent decrease in the rate
would reduce the postretirement benefit cost by approximately $0.2 million. As of December 31, 2009, a one
percent increase in the assumed healthcare cost trend rate would increase the postretirement benefit obligation by
approximately $3.6 million, while a one percent decrease in the rate would reduce the postretirement benefit
obligation by approximately $2.9 million.
Estimated future employer contributions, benefit payments, including executive retirement agreements, and
Medicare prescription drug subsidies expected to offset future postretirement benefit payments were as follows as
of December 31, 2009:
(Millions)
Pension
Benefits
Postretirement
Benefits
Expected employer contributions in 2010 $ 0.7 $ 10.0
Expected benefit payments:
2010 $ 66.6 $ 10.5
2011 68.6 7.8
2012 71.9 7.5
2013 73.8 7.3
2014 77.6 7.1
2015 – 2018 412.3 30.4
Expected Medicare prescription drug subsidies:
2010 $ (0.5)
2011 (0.3)
2012 (0.3)
2013 (0.4)
2014 (0.4)
2015 – 2018 (3.0)
F-60