Windstream 2009 Annual Report Download - page 126
Download and view the complete annual report
Please find page 126 of the 2009 Windstream annual report below. You can navigate through the pages in the report by either clicking on the pages listed below, or by using the keyword search tool below to find specific information within the annual report.-
 1
1 -
2
-
3
-
4
-
5
-
6
-
7
-
8
-
9
-
10
-
11
-
12
-
13
-
14
-
15
-
16
-
17
-
18
-
19
-
20
-
21
-
22
-
23
-
24
-
25
-
26
-
27
-
28
-
29
-
30
-
31
-
32
-
33
-
34
-
35
-
36
-
37
-
38
-
39
-
40
-
41
-
42
-
43
-
44
-
45
-
46
-
47
-
48
-
49
-
50
-
51
-
52
-
53
-
54
-
55
-
56
-
57
-
58
-
59
-
60
-
61
-
62
-
63
-
64
-
65
-
66
-
67
-
68
-
69
-
70
-
71
-
72
-
73
-
74
-
75
-
76
-
77
-
78
-
79
-
80
-
81
-
82
-
83
-
84
-
85
-
86
-
87
-
88
-
89
-
90
-
91
-
92
-
93
-
94
-
95
-
96
-
97
-
98
-
99
-
100
-
101
-
102
-
103
-
104
-
105
-
106
-
107
-
108
-
109
-
110
-
111
-
112
-
113
-
114
-
115
-
 116
116 -
 117
117 -
 118
118 -
 119
119 -
 120
120 -
 121
121 -
 122
122 -
 123
123 -
 124
124 -
 125
125 -
 126
126 -
 127
127 -
 128
128 -
 129
129 -
 130
130 -
 131
131 -
 132
132 -
 133
133 -
 134
134 -
 135
135 -
 136
136 -
137
-
138
-
139
-
140
-
141
-
142
-
143
-
144
-
145
-
146
-
147
-
148
-
149
-
150
-
151
-
152
-
153
-
154
-
155
-
156
-
157
-
158
-
159
-
160
-
161
-
162
-
163
-
164
-
165
-
166
-
167
-
168
-
169
-
170
-
171
-
172
-
173
-
174
-
175
-
176
-
177
-
178
-
179
-
180
-
181
-
182
-
183
-
184
-
185
-
186
-
187
-
188
-
189
-
190
-
191
-
192
-
193
-
194
-
195
-
196
 |
 |

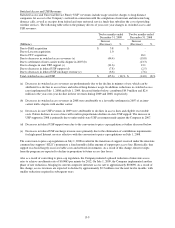
(c) Decreases in business taxes for both periods were attributable to a lower assessment for property and sales and use
taxes.
(d) Decreases in federal USF contributions were primarily due to the eliminations of contributions required for high-
speed Internet services effective with the conversion to price-cap regulation on July 1, 2008, as previously
discussed.
(e) The decrease in other employee benefits was primarily due to the reduction in postretirement benefits announced
in the third quarter of 2008, with additional reductions attributable to the impact of the workforce reduction
announced in the fourth quarter of 2008, as well as changes in other benefit programs.
(f) Decreases in network operations during 2009 were primarily attributable to the workforce reductions announced
in the fourth quarter of 2008 and third quarter 2009, and reductions in fuel costs. Decreases in 2008 were
primarily due to lower contract labor costs.
(g) Changes in interconnection expenses, or costs incurred by the Company to access the public switched network and
to transport traffic to the Internet, in 2009 were due to the favorable impact of network efficiency projects, the
impact of access line losses and rate reductions. Partially offsetting these decreases were increases associated with
purchases of higher capacity circuits to service the growth in high-speed Internet customers. Increases in 2008
were primarily attributable to increases in Internet customers and increases in the volume of long distance traffic
resulting from the increases in customers on packaged and unlimited usage rate plans, as previously discussed.
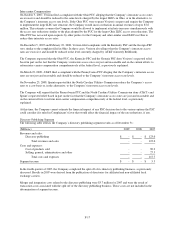
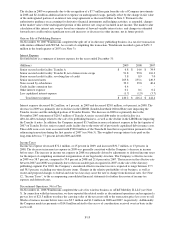
Cost of Products Sold
Cost of products sold represent the cost of equipment sales to customers, including sales of high-speed Internet
modems and customer premise equipment, as well as sales of computers to residential high-speed Internet customers.
The following table reflects the primary drivers of year-over-year changes in cost of products sold:
Twelve months ended
December 31, 2009
Twelve months ended
December 31, 2008
(Millions)
Increase
(Decrease) %
Increase
(Decrease) %
Due to D&E acquisition $ 0.2 $ -
Due to CTC acquisition - 2.9
Due to decreases associated with disposal of the out of
territory product distribution operations (34.0) -
Due to changes in residential cost of products sold (a) (5.5) 10.3
Due to changes in business cost of products sold and other (b) (23.0) 2.8
Total cost of products sold $ (62.3) (37)% $ 16.0 10%
(a) Changes in residential cost of products sold were primarily due to the mix of products sold.
(b) Changes in business costs of product sold were consistent with the declines in business product sales in 2009.
F-12