Windstream 2015 Annual Report Download - page 137
Download and view the complete annual report
Please find page 137 of the 2015 Windstream annual report below. You can navigate through the pages in the report by either clicking on the pages listed below, or by using the keyword search tool below to find specific information within the annual report.-
 1
1 -
2
-
3
-
4
-
5
-
6
-
7
-
8
-
9
-
10
-
11
-
12
-
13
-
14
-
15
-
16
-
17
-
18
-
19
-
20
-
21
-
22
-
23
-
24
-
25
-
26
-
27
-
28
-
29
-
30
-
31
-
32
-
33
-
34
-
35
-
36
-
37
-
38
-
39
-
40
-
41
-
42
-
43
-
44
-
45
-
46
-
47
-
48
-
49
-
50
-
51
-
52
-
53
-
54
-
55
-
56
-
57
-
58
-
59
-
60
-
61
-
62
-
63
-
64
-
65
-
66
-
67
-
68
-
69
-
70
-
71
-
72
-
73
-
74
-
75
-
76
-
77
-
78
-
79
-
80
-
81
-
82
-
83
-
84
-
85
-
86
-
87
-
88
-
89
-
90
-
91
-
92
-
93
-
94
-
95
-
96
-
97
-
98
-
99
-
100
-
101
-
102
-
103
-
104
-
105
-
106
-
107
-
108
-
109
-
110
-
111
-
112
-
113
-
114
-
115
-
116
-
117
-
118
-
119
-
120
-
121
-
122
-
123
-
124
-
125
-
126
-
 127
127 -
 128
128 -
 129
129 -
 130
130 -
 131
131 -
 132
132 -
 133
133 -
 134
134 -
 135
135 -
 136
136 -
 137
137 -
 138
138 -
 139
139 -
 140
140 -
 141
141 -
 142
142 -
 143
143 -
 144
144 -
 145
145 -
 146
146 -
 147
147 -
148
-
149
-
150
-
151
-
152
-
153
-
154
-
155
-
156
-
157
-
158
-
159
-
160
-
161
-
162
-
163
-
164
-
165
-
166
-
167
-
168
-
169
-
170
-
171
-
172
-
173
-
174
-
175
-
176
-
177
-
178
-
179
-
180
-
181
-
182
-
183
-
184
-
185
-
186
-
187
-
188
-
189
-
190
-
191
-
192
-
193
-
194
-
195
-
196
-
197
-
198
-
199
-
200
-
201
-
202
-
203
-
204
-
205
-
206
-
207
-
208
-
209
-
210
-
211
-
212
-
213
-
214
-
215
-
216
-
217
-
218
-
219
-
220
-
221
-
222
-
223
-
224
-
225
-
226
-
227
-
228
-
229
-
230
-
231
-
232
 |
 |

F-7
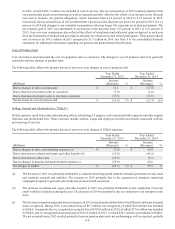
Product Sales
Product sales consist of sales of various types of communications equipment to our customers. We also sell network equipment
to contractors on a wholesale basis. Enterprise product sales includes high-end data and communications equipment which facilitate
the delivery of advanced data and voice services to our enterprise customers. Consumer product sales include high-speed Internet
modems, home networking equipment, computers and phones. Sales of high-speed Internet modems to consumers have declined
as a result of our implementation of a modem rental program.
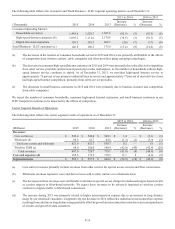
The following table reflects the primary drivers of year-over-year changes in product sales:
Year Ended
December 31, 2015
Year Ended
December 31, 2014
(Millions)
Increase
(Decrease) %
Increase
(Decrease) %
Due to changes in contractor sales $ 12.3 $ (13.1)
Due to decreases in enterprise product sales (12.9)(18.4)
Due to changes in consumer product sales (14.6) 0.9
Net decreases in product sales $ (15.2)(8) $ (30.6)(14)
Cost of Services
Cost of services expense primarily consists of charges incurred for network operations, interconnection, bad debt and business
taxes. Network operations charges include salaries and wages, materials, contractor costs, IT support and costs to lease certain
network facilities. Interconnection consists of charges incurred to access the public switched network and transport traffic to the
Internet, including charges paid to other carriers for access points where we do not own the primary network infrastructure. Other
expense consists of third-party costs for ancillary voice and data services, business and financial services, bad debt and business
taxes.
The following table reflects the primary drivers of year-over-year changes in cost of services:
Year Ended
December 31, 2015
Year Ended
December 31, 2014
(Millions)
Increase
(Decrease) %
Increase
(Decrease) %
Due to increases in interconnection expense (a) $ 76.1 $ 8.8
Due to increases in network operations (b) 32.9 4.0
Due to increases in federal USF expenses (c) 8.2 18.7
Due to changes in employee medical expenses (5.8) 7.6
Due to decreases in other expenses (20.7)(10.4)
Due to changes in pension and postretirement expense (d) (102.0) 203.4
Net changes in cost of services $ (11.3) — $ 232.1 9
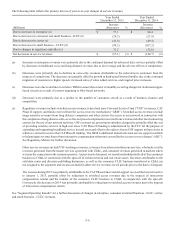
(a) Increases in interconnection expense were primarily attributable to increased purchases of circuits due to the growth in
data customers, as well as higher capacity circuits to service existing customers and increase the transport capacity of
our network, partially offset by rate reductions and cost improvements from the continuation of network efficiency
projects.
(b) Increases in network operations were primarily due to higher leased network facilities costs attributable to expansion of
our fiber transport network.
(c) Increases in the federal USF contributions were driven by an increase in the average USF contribution factor each year.
(d) The decrease in pension and postretirement expense in 2015 was primarily attributable to the difference in the net actuarial
losses recognized in the current and prior year periods. During 2015, we recognized a net actuarial loss of $8.7 million,
of which $6.7 million was included in cost of services. Comparatively, we recognized an actuarial loss of $128.6 million
in 2014, of which $101.0 million was recorded to cost of services, and we recognized an actuarial gain of $110.4 million