Windstream 2015 Annual Report Download - page 158
Download and view the complete annual report
Please find page 158 of the 2015 Windstream annual report below. You can navigate through the pages in the report by either clicking on the pages listed below, or by using the keyword search tool below to find specific information within the annual report.-
 1
1 -
2
-
3
-
4
-
5
-
6
-
7
-
8
-
9
-
10
-
11
-
12
-
13
-
14
-
15
-
16
-
17
-
18
-
19
-
20
-
21
-
22
-
23
-
24
-
25
-
26
-
27
-
28
-
29
-
30
-
31
-
32
-
33
-
34
-
35
-
36
-
37
-
38
-
39
-
40
-
41
-
42
-
43
-
44
-
45
-
46
-
47
-
48
-
49
-
50
-
51
-
52
-
53
-
54
-
55
-
56
-
57
-
58
-
59
-
60
-
61
-
62
-
63
-
64
-
65
-
66
-
67
-
68
-
69
-
70
-
71
-
72
-
73
-
74
-
75
-
76
-
77
-
78
-
79
-
80
-
81
-
82
-
83
-
84
-
85
-
86
-
87
-
88
-
89
-
90
-
91
-
92
-
93
-
94
-
95
-
96
-
97
-
98
-
99
-
100
-
101
-
102
-
103
-
104
-
105
-
106
-
107
-
108
-
109
-
110
-
111
-
112
-
113
-
114
-
115
-
116
-
117
-
118
-
119
-
120
-
121
-
122
-
123
-
124
-
125
-
126
-
127
-
128
-
129
-
130
-
131
-
132
-
133
-
134
-
135
-
136
-
137
-
138
-
139
-
140
-
141
-
142
-
143
-
144
-
145
-
146
-
147
-
 148
148 -
 149
149 -
 150
150 -
 151
151 -
 152
152 -
 153
153 -
 154
154 -
 155
155 -
 156
156 -
 157
157 -
 158
158 -
 159
159 -
 160
160 -
 161
161 -
 162
162 -
 163
163 -
 164
164 -
 165
165 -
 166
166 -
 167
167 -
 168
168 -
169
-
170
-
171
-
172
-
173
-
174
-
175
-
176
-
177
-
178
-
179
-
180
-
181
-
182
-
183
-
184
-
185
-
186
-
187
-
188
-
189
-
190
-
191
-
192
-
193
-
194
-
195
-
196
-
197
-
198
-
199
-
200
-
201
-
202
-
203
-
204
-
205
-
206
-
207
-
208
-
209
-
210
-
211
-
212
-
213
-
214
-
215
-
216
-
217
-
218
-
219
-
220
-
221
-
222
-
223
-
224
-
225
-
226
-
227
-
228
-
229
-
230
-
231
-
232
 |
 |

F-28
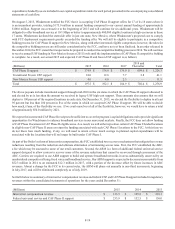
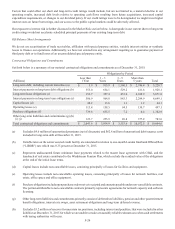
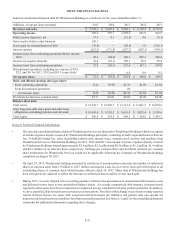
Reconciliation of non-GAAP financial measures
From time to time, we will reference certain non-GAAP measures in our filings. Management’s purpose for including these measures
is to provide investors with measures of performance that management uses in evaluating the performance of the business. These
non-GAAP measures should not be considered in isolation or as a substitute for measures of financial performance reported under
GAAP. Following is a reconciliation of non-GAAP financial measures to the most closely related financial measure reported under
GAAP referenced in this filing.
Operating income before depreciation and amortization to GAAP operating income:
(Millions) 2015 2014 %
Operating income $ 509.4 $ 507.1
Depreciation and amortization 1,366.5 1,386.4
OIBDA (a) $ 1,875.9 $ 1,893.5 (1)
(a) OIBDA is defined as operating income plus depreciation and amortization expense. We believe this measure provides
investors with insight into the core earnings capacity of providing communications and technology services to our
customers.
Critical Accounting Policies and Estimates
We prepare our consolidated financial statements in accordance with accounting principles generally accepted in the United States.
Our significant accounting policies are discussed in detail in Note 2 to the consolidated financial statements. Certain of these
accounting policies, as discussed below, require management to make estimates and assumptions about future events that could
materially affect the reported amounts of assets, liabilities, revenues and expenses and disclosure of contingent assets and liabilities.
We believe that the estimates, judgments and assumptions made when accounting for the items described below are reasonable,
based on information available at the time they are made. However, there can be no assurance that actual results will not differ
from those estimates.
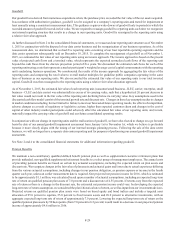
Allowance for Doubtful Accounts
In evaluating the collectability of our trade receivables, we assess a number of factors, including a specific customer’s ability to
meet its financial obligations to us, as well as general factors, such as the length of time the receivables are past due and historical
collection experience. Based on these assumptions, we record an allowance for doubtful accounts to reduce the related receivables
to the amount that we ultimately expect to collect from customers. If circumstances related to specific customers change or economic
conditions worsen such that our past collection experience is no longer relevant, our estimate of the recoverability of our trade
receivables could be further reduced from the levels provided for in the consolidated financial statements. A 10 percent change in
the amounts estimated to be uncollectible would result in a change in the provision for doubtful accounts of approximately $3.3
million for the year ended December 31, 2015.
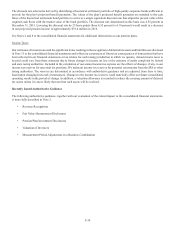
Useful Lives of Assets
The calculation of depreciation and amortization expense is based on the estimated economic useful lives of the underlying property,
plant and equipment and finite-lived intangible assets. Our regulated operations use a group composite depreciation method. Under
this method, when plant is retired, the original cost, net of salvage value, is charged against accumulated depreciation and no
immediate gain or loss is recognized on the disposition of the plant.
Rapid changes in technology or changes in market conditions could result in significant changes to the estimated useful lives of
our tangible or finite-lived intangible assets that could materially affect the carrying value of these assets and our future consolidated
operating results. An extension of the average useful life of our property, plant and equipment of one year would decrease
depreciation expense by approximately $84.0 million per year, while a reduction in the average useful life of one year would
increase depreciation expense by approximately $101.3 million per year.
At December 31, 2015, our unamortized finite-lived intangible assets totaled $1,504.7 million and primarily consisted of franchise
rights of $999.0 million and customer lists of $487.0 million. The customer lists are amortized using the sum-of-the-years digits
method over estimated useful lives ranging from 9 to 15 years. The franchise rights are amortized on a straight-line basis over
their estimated useful lives of 30 years. A reduction in the average useful lives of the franchise rights and customer lists of one
year would have increased the amount of amortization expense recorded in 2015 by approximately $3.3 million.