Windstream 2015 Annual Report Download - page 43
Download and view the complete annual report
Please find page 43 of the 2015 Windstream annual report below. You can navigate through the pages in the report by either clicking on the pages listed below, or by using the keyword search tool below to find specific information within the annual report.-
 1
1 -
2
-
3
-
4
-
5
-
6
-
7
-
8
-
9
-
10
-
11
-
12
-
13
-
14
-
15
-
16
-
17
-
18
-
19
-
20
-
21
-
22
-
23
-
24
-
25
-
26
-
27
-
28
-
29
-
30
-
31
-
32
-
 33
33 -
 34
34 -
 35
35 -
 36
36 -
 37
37 -
 38
38 -
 39
39 -
 40
40 -
 41
41 -
 42
42 -
 43
43 -
 44
44 -
 45
45 -
 46
46 -
 47
47 -
 48
48 -
 49
49 -
 50
50 -
 51
51 -
 52
52 -
 53
53 -
54
-
55
-
56
-
57
-
58
-
59
-
60
-
61
-
62
-
63
-
64
-
65
-
66
-
67
-
68
-
69
-
70
-
71
-
72
-
73
-
74
-
75
-
76
-
77
-
78
-
79
-
80
-
81
-
82
-
83
-
84
-
85
-
86
-
87
-
88
-
89
-
90
-
91
-
92
-
93
-
94
-
95
-
96
-
97
-
98
-
99
-
100
-
101
-
102
-
103
-
104
-
105
-
106
-
107
-
108
-
109
-
110
-
111
-
112
-
113
-
114
-
115
-
116
-
117
-
118
-
119
-
120
-
121
-
122
-
123
-
124
-
125
-
126
-
127
-
128
-
129
-
130
-
131
-
132
-
133
-
134
-
135
-
136
-
137
-
138
-
139
-
140
-
141
-
142
-
143
-
144
-
145
-
146
-
147
-
148
-
149
-
150
-
151
-
152
-
153
-
154
-
155
-
156
-
157
-
158
-
159
-
160
-
161
-
162
-
163
-
164
-
165
-
166
-
167
-
168
-
169
-
170
-
171
-
172
-
173
-
174
-
175
-
176
-
177
-
178
-
179
-
180
-
181
-
182
-
183
-
184
-
185
-
186
-
187
-
188
-
189
-
190
-
191
-
192
-
193
-
194
-
195
-
196
-
197
-
198
-
199
-
200
-
201
-
202
-
203
-
204
-
205
-
206
-
207
-
208
-
209
-
210
-
211
-
212
-
213
-
214
-
215
-
216
-
217
-
218
-
219
-
220
-
221
-
222
-
223
-
224
-
225
-
226
-
227
-
228
-
229
-
230
-
231
-
232
 |
 |

| 41
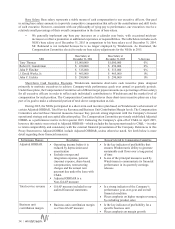
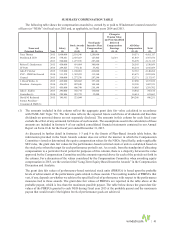
SUMMARY COMPENSATION TABLE
The following table shows the compensation awarded to, earned by or paid to Windstream’s named executive
officers (or “NEOs”) in fiscal year 2015 and, as applicable, in fiscal years 2014 and 2013.
Name and
Principal Position Year Salary
($)
Stock Awards
($)
(1) (2)
Non-Equity
Incentive Plan
Compensation
($) (3)
Change in
Pension Value
and Non-Qualified
Deferred
Compensation
Earnings
($) (4)
All Other
Compensation
($) (5) Total
($)
Tony Thomas 2015 1,000,000 2,101,546 1,250,000 — 59,571 4,411,117
President & CEO 2014 538,461 2,607,453 127,400 32,319 61,843 3,367,476
2013 500,000 1,277,576 287,240 — 56,299 2,121,115
Robert E. Gunderman 2015 450,000 691,464 360,000 — 28,595 1,530,059
CFO (6) 2014 289,823 777,110 33,302 — 66,234 1,166,469
John P. Fletcher 2015 515,000 1,180,901 412,000 — 32,363 2,140,264
EVP – CHRO & General 2014 511,538 1,382,453 115,360 — 43,675 2,053,026
Counsel 2013 500,000 1,277,576 287,240 — 52,371 2,117,187
J. David Works, Jr. 2015 465,000 828,682 357,120 — 27,050 1,677,852
President – Enterprise 2014 456,923 807,840 104,160 — 38,398 1,407,321
2013 430,000 606,749 216,148 — 38,805 1,291,702
John C. Eichler 2015 290,000 345,774 116,000 — 14,842 766,616
Controller (6) 2014 288,846 283,723 32,480 — 16,614 621,663
David M. Redmond 2015 190,961 521,044 __ __ 284,246 996,251
Former President –
Consumer & SMB (6)
(1) The amounts included in this column reflect the aggregate grant date fair value calculated in accordance
with FASB ASC Topic 718. The fair value reflects the expected future cash flows of dividends and therefore
dividends on unvested shares are not separately disclosed. The amounts in this column for each fiscal year
exclude the effect of any estimated forfeitures of such awards. The assumptions used in the calculation of these
amounts are included in footnote 9 of our audited consolidated financial statements contained in our Annual
Report on Form 10-K for the fiscal year ended December 31, 2015.
As discussed in further detail in footnotes 1–3 and 9 to the Grants of Plan-Based Awards table below, the
information provided in the Stock Awards column does not reflect the manner in which the Compensation
Committee viewed or determined the equity compensation values for the NEOs. Specifically, under applicable
SEC rules, the grant date fair values for the performance-based restricted stock or units is calculated based on
the stock price when the target for each performance period is set. As a result, from the standpoint of allocating
compensation to a particular fiscal period for purposes of this column, there is a disparity between the value
approved by the Compensation Committee and the amounts reported above for each of the periods set forth in
the column. For a discussion of the values considered by the Compensation Committee when awarding equity
compensation in 2015, see the section titled “Long-Term Equity Based Incentive Awards” in the Compensation
Discussion and Analysis.
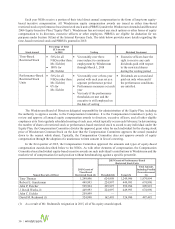
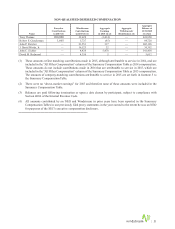
The grant date fair values of performance-based restricted stock units (PBRSUs) is based upon the probable
levels of achievement of the performance goals related to those awards. The resulting number of PBRSUs that
vest, if any, depends on whether we achieve the specified level of performance with respect to the performance
measures tied to these awards. The grant date fair values of PBRSUs are reported in the table above at the
probable payout, which is less than the maximum possible payout. The table below shows the grant date fair
values of the PBRSUs granted to each NEO during fiscal year 2015 at the probable payout and the maximum
payout that would result if the highest levels of performance goals are achieved.