Windstream 2015 Annual Report Download - page 205
Download and view the complete annual report
Please find page 205 of the 2015 Windstream annual report below. You can navigate through the pages in the report by either clicking on the pages listed below, or by using the keyword search tool below to find specific information within the annual report.-
 1
1 -
2
-
3
-
4
-
5
-
6
-
7
-
8
-
9
-
10
-
11
-
12
-
13
-
14
-
15
-
16
-
17
-
18
-
19
-
20
-
21
-
22
-
23
-
24
-
25
-
26
-
27
-
28
-
29
-
30
-
31
-
32
-
33
-
34
-
35
-
36
-
37
-
38
-
39
-
40
-
41
-
42
-
43
-
44
-
45
-
46
-
47
-
48
-
49
-
50
-
51
-
52
-
53
-
54
-
55
-
56
-
57
-
58
-
59
-
60
-
61
-
62
-
63
-
64
-
65
-
66
-
67
-
68
-
69
-
70
-
71
-
72
-
73
-
74
-
75
-
76
-
77
-
78
-
79
-
80
-
81
-
82
-
83
-
84
-
85
-
86
-
87
-
88
-
89
-
90
-
91
-
92
-
93
-
94
-
95
-
96
-
97
-
98
-
99
-
100
-
101
-
102
-
103
-
104
-
105
-
106
-
107
-
108
-
109
-
110
-
111
-
112
-
113
-
114
-
115
-
116
-
117
-
118
-
119
-
120
-
121
-
122
-
123
-
124
-
125
-
126
-
127
-
128
-
129
-
130
-
131
-
132
-
133
-
134
-
135
-
136
-
137
-
138
-
139
-
140
-
141
-
142
-
143
-
144
-
145
-
146
-
147
-
148
-
149
-
150
-
151
-
152
-
153
-
154
-
155
-
156
-
157
-
158
-
159
-
160
-
161
-
162
-
163
-
164
-
165
-
166
-
167
-
168
-
169
-
170
-
171
-
172
-
173
-
174
-
175
-
176
-
177
-
178
-
179
-
180
-
181
-
182
-
183
-
184
-
185
-
186
-
187
-
188
-
189
-
190
-
191
-
192
-
193
-
194
-
 195
195 -
 196
196 -
 197
197 -
 198
198 -
 199
199 -
 200
200 -
 201
201 -
 202
202 -
 203
203 -
 204
204 -
 205
205 -
 206
206 -
 207
207 -
 208
208 -
 209
209 -
 210
210 -
 211
211 -
 212
212 -
 213
213 -
 214
214 -
 215
215 -
216
-
217
-
218
-
219
-
220
-
221
-
222
-
223
-
224
-
225
-
226
-
227
-
228
-
229
-
230
-
231
-
232
 |
 |

NOTES TO CONSOLIDATED FINANCIAL STATEMENTS
____
F-75
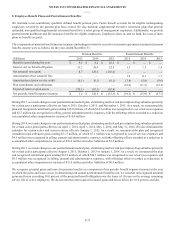
8. Employee Benefit Plans and Postretirement Benefits, Continued:
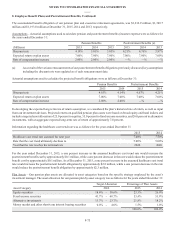
The accumulated benefit obligation of our pension plan and executive retirement agreements, was $1,236.9 million, $1,309.7
million and $1,193.0 million at December 31, 2015, 2014 and 2013, respectively.
Assumptions – Actuarial assumptions used to calculate pension and postretirement benefits (income) expense were as follows for
the years ended December 31:
Pension Benefits Postretirement Benefits (a)
(Millions) 2015 2014 2013 2015 2014 2013
Discount rate 4.14% 5.01% 3.85% 4.21% 4.76% 3.87%
Expected return on plan assets 7.00% 7.00% 7.00% 7.00% 7.00% 7.00%
Rate of compensation increase 2.00% 2.00% 2.00% —% —% —%
(a) As a result of the various remeasurements of our postretirement benefit obligations previously discussed, key assumptions
including the discount rate were updated as of each remeasurement date.
Actuarial assumptions used to calculate the projected benefit obligations were as follows at December 31:
Pension Benefits Postretirement Benefits
2015 2014 2015 2014
Discount rate 4.55% 4.14% 4.67% 4.21%
Expected return on plan assets 7.00% 7.00% 7.00% 7.00%
Rate of compensation increase 2.00% 2.00% —% —%
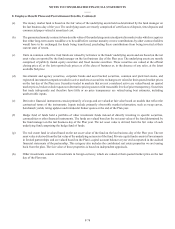
In developing the expected long-term rate of return assumption, we considered the plan’s historical rate of return, as well as input
from our investment advisors. Projected returns on qualified pension plan assets were based on broad equity and bond indices and
include a targeted asset allocation of 25.0 percent to equities, 55.0 percent to fixed income securities, and 20.0 percent to alternative
investments, with an aggregate expected long-term rate of return of approximately 7.0 percent.
Information regarding the healthcare cost trend rate was as follows for the years ended December 31:
2015 2014
Healthcare cost trend rate assumed for next year 7.00% 7.50%
Rate that the cost trend ultimately declines to 5.00% 5.00%
Year that the rate reaches the terminal rate 2024 2020
For the year ended December 31, 2015, a one percent increase in the assumed healthcare cost trend rate would increase the
postretirement benefit cost by approximately $0.1 million, while a one percent decrease in the rate would reduce the postretirement
benefit cost by approximately $0.1 million. As of December 31, 2015, a one percent increase in the assumed healthcare cost trend
rate would increase the postretirement benefit obligation by approximately $2.8 million, while a one percent decrease in the rate
would reduce the postretirement benefit obligation by approximately $2.3 million.
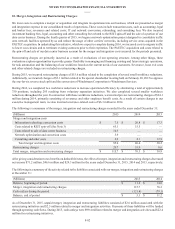
Plan Assets – Our pension plan assets are allocated to asset categories based on the specific strategy employed by the asset’s
investment manager. The asset allocation for our pension plan by asset category was as follows for the years ended December 31:
Target Allocation Percentage of Plan Assets
Asset Category 2016 2015 2014
Equity securities 18.6% - 30.6% 23.3% 26.9%
Fixed income securities 41.7% - 68.7% 53.4% 53.9%
Alternative investments 13.7% - 23.7% 21.8% 18.2%
Money market and other short-term interest bearing securities 0.0% - 4.0% 1.5% 1.0%
100.0% 100.0%