Windstream 2015 Annual Report Download - page 159
Download and view the complete annual report
Please find page 159 of the 2015 Windstream annual report below. You can navigate through the pages in the report by either clicking on the pages listed below, or by using the keyword search tool below to find specific information within the annual report.-
 1
1 -
2
-
3
-
4
-
5
-
6
-
7
-
8
-
9
-
10
-
11
-
12
-
13
-
14
-
15
-
16
-
17
-
18
-
19
-
20
-
21
-
22
-
23
-
24
-
25
-
26
-
27
-
28
-
29
-
30
-
31
-
32
-
33
-
34
-
35
-
36
-
37
-
38
-
39
-
40
-
41
-
42
-
43
-
44
-
45
-
46
-
47
-
48
-
49
-
50
-
51
-
52
-
53
-
54
-
55
-
56
-
57
-
58
-
59
-
60
-
61
-
62
-
63
-
64
-
65
-
66
-
67
-
68
-
69
-
70
-
71
-
72
-
73
-
74
-
75
-
76
-
77
-
78
-
79
-
80
-
81
-
82
-
83
-
84
-
85
-
86
-
87
-
88
-
89
-
90
-
91
-
92
-
93
-
94
-
95
-
96
-
97
-
98
-
99
-
100
-
101
-
102
-
103
-
104
-
105
-
106
-
107
-
108
-
109
-
110
-
111
-
112
-
113
-
114
-
115
-
116
-
117
-
118
-
119
-
120
-
121
-
122
-
123
-
124
-
125
-
126
-
127
-
128
-
129
-
130
-
131
-
132
-
133
-
134
-
135
-
136
-
137
-
138
-
139
-
140
-
141
-
142
-
143
-
144
-
145
-
146
-
147
-
148
-
 149
149 -
 150
150 -
 151
151 -
 152
152 -
 153
153 -
 154
154 -
 155
155 -
 156
156 -
 157
157 -
 158
158 -
 159
159 -
 160
160 -
 161
161 -
 162
162 -
 163
163 -
 164
164 -
 165
165 -
 166
166 -
 167
167 -
 168
168 -
 169
169 -
170
-
171
-
172
-
173
-
174
-
175
-
176
-
177
-
178
-
179
-
180
-
181
-
182
-
183
-
184
-
185
-
186
-
187
-
188
-
189
-
190
-
191
-
192
-
193
-
194
-
195
-
196
-
197
-
198
-
199
-
200
-
201
-
202
-
203
-
204
-
205
-
206
-
207
-
208
-
209
-
210
-
211
-
212
-
213
-
214
-
215
-
216
-
217
-
218
-
219
-
220
-
221
-
222
-
223
-
224
-
225
-
226
-
227
-
228
-
229
-
230
-
231
-
232
 |
 |

F-29
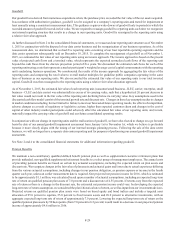
Goodwill
Our goodwill was derived from numerous acquisitions where the purchase price exceeded the fair value of the net assets acquired.
In accordance with authoritative guidance, goodwill is to be assigned to a company’s reporting units and tested for impairment at
least annually using a consistent measurement date. This guidance requires write-downs of goodwill only in periods in which the
recorded amount of goodwill exceeds its fair value. We are required to reassign goodwill to reporting units each time we reorganize
our internal reporting structure that results in a change in our reporting units. Goodwill is reassigned to the reporting units using
a relative fair value approach.
As further discussed in Note 2 to the consolidated financial statements, we reassessed our reporting unit structure as of November
1, 2015 in conjunction with the disposal of our data center business and the reorganization of our business operations. As of the
reassessment date, we determined that we had five reporting units consisting of our four reportable operating segments and the
data center operations subsequently sold on December 18, 2015. To complete the reassignment of goodwill as of November 1,
2015, we estimated the fair value of our reporting units using an income approach. The income approach is based on the present
value of projected cash flows and a terminal value, which represents the expected normalized cash flows of the reporting unit
beyond the cash flows from the discrete projection period of five years. We discounted the estimated cash flows for each of the
reporting units using a rate that represents a market participant’s weighted average cost of capital commensurate with the reporting
unit’s underlying business operations. We corroborated the results of the income approach by aggregating the fair values of the
reporting units and comparing the total value to overall market multiples for guideline public companies operating in the same
lines of business as our reporting units. We also reconciled the estimated fair value of our reporting units to our total invested
capital. Goodwill was then reassigned to the reporting units using a relative fair value allocation approach.
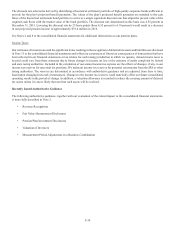
As of November 1, 2015, the estimated fair value of each reporting unit (consumer/small business - ILEC, carrier, enterprise, small
business - CLEC and data center) was substantially in excess of its carrying value, such that a hypothetical 20 percent decrease in
fair value would not result in the fair value of the reporting unit declining below its carrying value. Key assumptions used in the
discounted cash flow model consist of the terminal growth rate and discount rate. Changes in these key assumptions due to changes
in market conditions including, but not limited to: failure to meet our forecasted future operating results, the effects of competition,
adverse changes as a result of regulatory or legislative actions, higher than expected customer churn and changes in the cost of
capital of other industry market participants could adversely affect the calculated fair value of our reporting units, and in turn,
materially impact the carrying value of goodwill and our future consolidated operating results.
In conjunction with our change in reporting units and the reallocation of goodwill, we have also elected to change on a go forward
basis the date of our annual goodwill impairment assessment from January 1st to November 1st, which we believe is preferable
because it more closely aligns with the timing of our internal strategic planning process. Following the sale of the data center
business, we will no longer have a separate data center reporting unit for purposes of performing our annual goodwill impairment
assessment.
See Note 2 and 4 to the consolidated financial statements for additional information regarding goodwill.
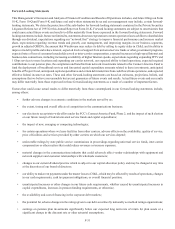
Pension Benefits
We maintain a non-contributory qualified defined benefit pension plan as well as supplemental executive retirement plans that
provide unfunded, non-qualified supplemental retirement benefits to a select group of management employees. The annual costs
of providing pension benefits are based on certain key actuarial assumptions, including the expected return on plan assets and
discount rate. We recognize changes in the fair value of plan assets and actuarial gains and losses due to actual experience differing
from the various actuarial assumptions, including changes in our pension obligation, as pension expense or income in the fourth
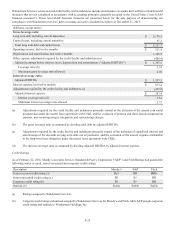
quarter each year, unless an earlier measurement date is required. Our projected net pension income for 2016, which is estimated
to be approximately $1.1 million, was calculated based upon a number of actuarial assumptions, including an expected long-term
rate of return on qualified pension plan assets of 7.0 percent and a discount rate of 4.55 percent. If returns vary from the expected
rate of return or there is a change in the discount rate, the estimated net pension income could vary. In developing the expected
long-term rate of return assumption, we considered the plan’s historical rate of return, as well as input from our investment advisors.
Projected returns on qualified pension plan assets were based on broad equity and bond indices and include a targeted asset
allocation of 25.0 percent to equities, 55.0 percent to fixed income assets and 20.0 percent to alternative investments, with an
aggregate expected long-term rate of return of approximately 7.0 percent. Lowering the expected long-term rate of return on the
qualified pension plan assets by 50 basis points (from 7.0 percent to 6.5 percent) would result in a decrease in our projected pension
income of approximately $4.6 million in 2016.