Windstream 2015 Annual Report Download - page 152
Download and view the complete annual report
Please find page 152 of the 2015 Windstream annual report below. You can navigate through the pages in the report by either clicking on the pages listed below, or by using the keyword search tool below to find specific information within the annual report.-
 1
1 -
2
-
3
-
4
-
5
-
6
-
7
-
8
-
9
-
10
-
11
-
12
-
13
-
14
-
15
-
16
-
17
-
18
-
19
-
20
-
21
-
22
-
23
-
24
-
25
-
26
-
27
-
28
-
29
-
30
-
31
-
32
-
33
-
34
-
35
-
36
-
37
-
38
-
39
-
40
-
41
-
42
-
43
-
44
-
45
-
46
-
47
-
48
-
49
-
50
-
51
-
52
-
53
-
54
-
55
-
56
-
57
-
58
-
59
-
60
-
61
-
62
-
63
-
64
-
65
-
66
-
67
-
68
-
69
-
70
-
71
-
72
-
73
-
74
-
75
-
76
-
77
-
78
-
79
-
80
-
81
-
82
-
83
-
84
-
85
-
86
-
87
-
88
-
89
-
90
-
91
-
92
-
93
-
94
-
95
-
96
-
97
-
98
-
99
-
100
-
101
-
102
-
103
-
104
-
105
-
106
-
107
-
108
-
109
-
110
-
111
-
112
-
113
-
114
-
115
-
116
-
117
-
118
-
119
-
120
-
121
-
122
-
123
-
124
-
125
-
126
-
127
-
128
-
129
-
130
-
131
-
132
-
133
-
134
-
135
-
136
-
137
-
138
-
139
-
140
-
141
-
 142
142 -
 143
143 -
 144
144 -
 145
145 -
 146
146 -
 147
147 -
 148
148 -
 149
149 -
 150
150 -
 151
151 -
 152
152 -
 153
153 -
 154
154 -
 155
155 -
 156
156 -
 157
157 -
 158
158 -
 159
159 -
 160
160 -
 161
161 -
 162
162 -
163
-
164
-
165
-
166
-
167
-
168
-
169
-
170
-
171
-
172
-
173
-
174
-
175
-
176
-
177
-
178
-
179
-
180
-
181
-
182
-
183
-
184
-
185
-
186
-
187
-
188
-
189
-
190
-
191
-
192
-
193
-
194
-
195
-
196
-
197
-
198
-
199
-
200
-
201
-
202
-
203
-
204
-
205
-
206
-
207
-
208
-
209
-
210
-
211
-
212
-
213
-
214
-
215
-
216
-
217
-
218
-
219
-
220
-
221
-
222
-
223
-
224
-
225
-
226
-
227
-
228
-
229
-
230
-
231
-
232
 |
 |

F-22
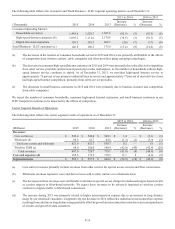
Our unrestricted cash position increased by $3.5 million to $31.3 million at December 31, 2015, from $27.8 million at December 31,
2014, as compared to a decrease of $20.4 million during 2014. Cash inflows during 2015 were primarily from operating activities,
cash payments from CS&L related to the spin-off and funding for tenant capital improvements, proceeds from the sale of our data
center business, and incremental borrowings under the revolving line of credit. These inflows were partially offset by cash outflows
for repayments of debt, capital expenditures, dividend payments to shareholders, payments under our long-term and capital lease
obligations, and repurchases of our common stock.
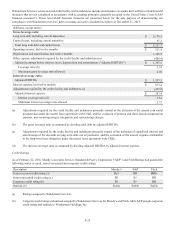
A summary of our historical cash flows were as follows for the years ended December 31:
(Millions) 2015 2014 2013
Cash flows provided from (used in):
Operating activities $ 1,026.6 $ 1,467.3 $ 1,519.4
Investing activities (522.0)(769.1)(707.6)
Financing activities (501.1)(718.6)(895.6)
Increase (decrease) in cash and cash equivalents $ 3.5 $ (20.4) $ (83.8)
Cash Flows – Operating Activities
Cash provided from operations is our primary source of funds. Cash flows from operating activities decreased by $440.7 million
in 2015, and $52.1 million in 2014 as compared to the prior year period. The decrease in 2015 was primarily due to additional
interest paid of $351.6 million attributable to the master lease agreement with CS&L. Decreases in small business and carrier
revenues, increased interconnection and transaction costs related to the REIT spin-off and sale of the data center business also
contributed to the decrease in cash flows from operations in 2015. The decrease in 2014 is primarily attributable to lower earnings,
as our operating results were negatively impacted by decreases in voice, long-distance, carrier revenues and costs associated with
various restructuring initiatives completed during the year. The decrease was partially offset by a reduction in cash interest paid
of $41.3 million.
We utilized net operating loss carryforwards (“NOLs”) and other income tax initiatives to lower our cash income tax obligations
for both 2015 and 2014. We expect cash income tax payments to be less than $20.0 million in 2016.
In September 2015, Windstream’s board of directors adopted a shareholder rights plan designed to protect our NOLs from the
effect of limitations imposed by federal and state tax rules following an ownership change. This plan was designed to deter an
ownership change (as defined in IRC Section 382) from occurring, and therefore protect our ability to utilize our federal and state
net operating loss carry forwards in the future. The plan is not meant to be an anti-takeover measure and our board of directors
has established a procedure to consider requests to exempt the acquisition of Windstream common stock from the rights plan, if
such acquisition would not limit or impair the availability of our NOLs.
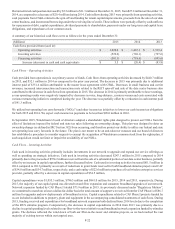
Cash Flows – Investing Activities
Cash used in investing activities primarily includes investments in our network to upgrade and expand our service offerings as
well as spending on strategic initiatives. Cash used in investing activities decreased $247.1 million in 2015 compared to 2014
primarily due to the proceeds of $574.2 million received from the sale of a substantial portion of our data center business, partially
offset by an increase in capital expenditures, further discussed below. Cash used in investing activities increased $61.5 million in
2014 compared to 2013 primarily as a result of reductions in grant funds received for both broadband stimulus projects and CAF
of $34.8 million and $34.7 million, respectively, and a cash outlay of $22.6 million to purchase a fixed wireless enterprise services
provider, partially offset by a decrease in capital expenditures of $54.5 million.
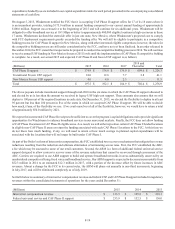
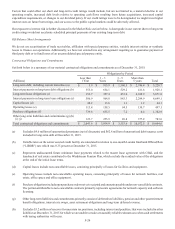
Capital expenditures were $1,055.3 million, $786.5 million and $841.0 million for 2015, 2014 and 2013, respectively. During
2015, the majority of our capital spend was directed toward fiber expansion and consumer broadband upgrades of our network.
Network expansion funded by CAF Phase I totaled $73.9 million in 2015. As previously discussed under “Regulatory Matters”,
we committed to match on at least a dollar-for-dollar basis the total amount of support we received from the CAF Phase I of $86.7
million for upgrades and new deployments of broadband service. Capital expenditures related to CAF Phase I projects funded by
us are included in additions to property, plant and equipment in the accompanying consolidated statements of cash flows. During
2015, funding received and expenditures for broadband network expansion both declined from 2014 levels due to the completion
of the RUS stimulus program. Comparatively, the decrease in capital expenditures in 2014 from 2013 was primarily due to a
decline in capital spending levels related to our fiber-to-the-tower initiatives and broadband network expansion funded by stimulus
grants. The declines reflected the wind down of both our fiber-to-the-tower and stimulus projects, as we had reached the vast
majority of existing towers within our targeted area.