Windstream 2015 Annual Report Download - page 138
Download and view the complete annual report
Please find page 138 of the 2015 Windstream annual report below. You can navigate through the pages in the report by either clicking on the pages listed below, or by using the keyword search tool below to find specific information within the annual report.-
 1
1 -
2
-
3
-
4
-
5
-
6
-
7
-
8
-
9
-
10
-
11
-
12
-
13
-
14
-
15
-
16
-
17
-
18
-
19
-
20
-
21
-
22
-
23
-
24
-
25
-
26
-
27
-
28
-
29
-
30
-
31
-
32
-
33
-
34
-
35
-
36
-
37
-
38
-
39
-
40
-
41
-
42
-
43
-
44
-
45
-
46
-
47
-
48
-
49
-
50
-
51
-
52
-
53
-
54
-
55
-
56
-
57
-
58
-
59
-
60
-
61
-
62
-
63
-
64
-
65
-
66
-
67
-
68
-
69
-
70
-
71
-
72
-
73
-
74
-
75
-
76
-
77
-
78
-
79
-
80
-
81
-
82
-
83
-
84
-
85
-
86
-
87
-
88
-
89
-
90
-
91
-
92
-
93
-
94
-
95
-
96
-
97
-
98
-
99
-
100
-
101
-
102
-
103
-
104
-
105
-
106
-
107
-
108
-
109
-
110
-
111
-
112
-
113
-
114
-
115
-
116
-
117
-
118
-
119
-
120
-
121
-
122
-
123
-
124
-
125
-
126
-
127
-
 128
128 -
 129
129 -
 130
130 -
 131
131 -
 132
132 -
 133
133 -
 134
134 -
 135
135 -
 136
136 -
 137
137 -
 138
138 -
 139
139 -
 140
140 -
 141
141 -
 142
142 -
 143
143 -
 144
144 -
 145
145 -
 146
146 -
 147
147 -
 148
148 -
149
-
150
-
151
-
152
-
153
-
154
-
155
-
156
-
157
-
158
-
159
-
160
-
161
-
162
-
163
-
164
-
165
-
166
-
167
-
168
-
169
-
170
-
171
-
172
-
173
-
174
-
175
-
176
-
177
-
178
-
179
-
180
-
181
-
182
-
183
-
184
-
185
-
186
-
187
-
188
-
189
-
190
-
191
-
192
-
193
-
194
-
195
-
196
-
197
-
198
-
199
-
200
-
201
-
202
-
203
-
204
-
205
-
206
-
207
-
208
-
209
-
210
-
211
-
212
-
213
-
214
-
215
-
216
-
217
-
218
-
219
-
220
-
221
-
222
-
223
-
224
-
225
-
226
-
227
-
228
-
229
-
230
-
231
-
232
 |
 |

F-8
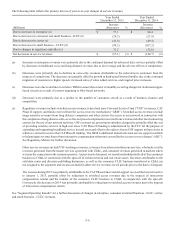
in 2013, of which $83.7 million was included in cost of services. The net actuarial loss in 2015 resulted primarily from
our pension plan assets not performing as well as expected, partially offset by the effects of an increase in the discount
rate used to measure our pension obligations, which increased from 4.14 percent in 2014 to 4.55 percent in 2015.
Conversely, the net actuarial loss in 2014 resulted from a decrease in the discount rate from 5.01 percent in 2013 to 4.14
percent in 2014 and changes to our mortality assumptions reflecting longer life expectancies of plan participants. The
net actuarial gain in 2013 was attributable to an increase in the discount from 3.85 percent in 2012 to 5.01 percent in
2013. Year-over-year comparisons also reflected the effects of curtailment and settlement gains recognized in each year
from the elimination of medical and prescription subsidies for certain active and retired participants. These gains reduced
cost of services by $14.3 million in 2015 compared to $7.1 million in 2014. See Note 8 to the consolidated financial
statements for additional information regarding our pension and postretirement benefit plans.
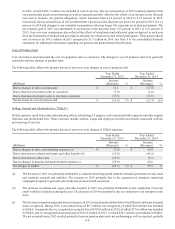
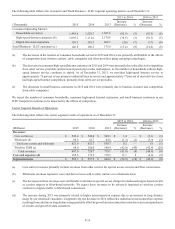
Cost of Products Sold
Cost of products sold represents the cost of equipment sales to customers. The changes in cost of products sold were generally
consistent with the changes in product sales.
The following table reflects the primary drivers of year-over-year changes in cost of products sold:
Year Ended
December 31, 2015
Year Ended
December 31, 2014
(Millions)
Increase
(Decrease) %
Increase
(Decrease) %
Due to changes in sales to contractors $ 12.1 $ (12.9)
Due to decreases in product sales to consumers (7.9)(1.6)
Due to decreases in product sales to enterprise customers (15.6)(12.8)
Net decreases in cost of products sold $(11.4)(7) $ (27.3)(15)
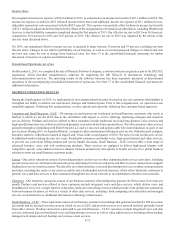
Selling, General and Administrative (“SG&A”)
SG&A expenses result from sales and marketing efforts, advertising, IT support, costs associated with corporate and other support
functions and professional fees. These expenses include salaries, wages and employee benefits not directly associated with the
provisioning of services.
The following table reflects the primary drivers of year-over-year changes in SG&A expenses:
Year Ended
December 31, 2015
Year Ended
December 31, 2014
(Millions)
Increase
(Decrease) %
Increase
(Decrease) %
Due to changes in sales and marketing expenses (a) $ (7.0) $ 45.8
Due to decreases in salaries and wages and other benefits (b) (13.0)(46.2)
Due to decreases in other costs (14.4)(6.1)
Due to changes in pension and postretirement expense (c) (28.9) 62.0
Net changes in SG&A $ (63.3)(7) $ 55.5 6
(a) The decrease in 2015 was primarily attributable to reduced advertising spend related to demand generation of sales leads
and customer research and analytics. The increase in 2014 primarily due to the expansion of enterprise marketing
campaigns designed to generate sales leads and promote brand awareness.
(b) The decrease in salaries and wages and other benefits in 2015 was primarily attributable to the completion of several
small workforce reductions during the year. The decrease in 2014 was primarily due to a reduction in our enterprise sales
force.
(c) The decrease in pension and postretirement expense in 2015 was primarily attributable to the difference in the net actuarial
losses recognized. During 2015, a net actuarial loss of $8.7 million was recognized, of which $2.0 million was included
in SG&A. Comparatively, we recognized an actuarial loss of $128.6 million in 2014, of which $27.6 million was included
in SG&A, and we recognized an actuarial gain of $110.4 million in 2013, of which $26.7 million was included in SG&A.
The net actuarial loss in 2015 resulted primarily from our pension plan assets not performing as well as expected, partially