Windstream 2015 Annual Report Download - page 146
Download and view the complete annual report
Please find page 146 of the 2015 Windstream annual report below. You can navigate through the pages in the report by either clicking on the pages listed below, or by using the keyword search tool below to find specific information within the annual report.-
 1
1 -
2
-
3
-
4
-
5
-
6
-
7
-
8
-
9
-
10
-
11
-
12
-
13
-
14
-
15
-
16
-
17
-
18
-
19
-
20
-
21
-
22
-
23
-
24
-
25
-
26
-
27
-
28
-
29
-
30
-
31
-
32
-
33
-
34
-
35
-
36
-
37
-
38
-
39
-
40
-
41
-
42
-
43
-
44
-
45
-
46
-
47
-
48
-
49
-
50
-
51
-
52
-
53
-
54
-
55
-
56
-
57
-
58
-
59
-
60
-
61
-
62
-
63
-
64
-
65
-
66
-
67
-
68
-
69
-
70
-
71
-
72
-
73
-
74
-
75
-
76
-
77
-
78
-
79
-
80
-
81
-
82
-
83
-
84
-
85
-
86
-
87
-
88
-
89
-
90
-
91
-
92
-
93
-
94
-
95
-
96
-
97
-
98
-
99
-
100
-
101
-
102
-
103
-
104
-
105
-
106
-
107
-
108
-
109
-
110
-
111
-
112
-
113
-
114
-
115
-
116
-
117
-
118
-
119
-
120
-
121
-
122
-
123
-
124
-
125
-
126
-
127
-
128
-
129
-
130
-
131
-
132
-
133
-
134
-
135
-
 136
136 -
 137
137 -
 138
138 -
 139
139 -
 140
140 -
 141
141 -
 142
142 -
 143
143 -
 144
144 -
 145
145 -
 146
146 -
 147
147 -
 148
148 -
 149
149 -
 150
150 -
 151
151 -
 152
152 -
 153
153 -
 154
154 -
 155
155 -
 156
156 -
157
-
158
-
159
-
160
-
161
-
162
-
163
-
164
-
165
-
166
-
167
-
168
-
169
-
170
-
171
-
172
-
173
-
174
-
175
-
176
-
177
-
178
-
179
-
180
-
181
-
182
-
183
-
184
-
185
-
186
-
187
-
188
-
189
-
190
-
191
-
192
-
193
-
194
-
195
-
196
-
197
-
198
-
199
-
200
-
201
-
202
-
203
-
204
-
205
-
206
-
207
-
208
-
209
-
210
-
211
-
212
-
213
-
214
-
215
-
216
-
217
-
218
-
219
-
220
-
221
-
222
-
223
-
224
-
225
-
226
-
227
-
228
-
229
-
230
-
231
-
232
 |
 |

F-16
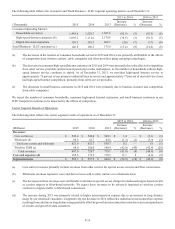
The following table reflects the Consumer and Small Business - ILEC segment operating metrics as of December 31:
2015 to 2014 2014 to 2013
(Thousands) 2015 2014 2013
Increase
(Decrease) %
Increase
(Decrease) %
Consumer Operating Metrics:
Households served (a) 1,445.8 1,528.7 1,621.2 (82.9)(5)(92.5)(6)
High-speed Internet customers (b) 1,095.1 1,131.6 1,170.9 (36.5)(3)(39.3)(3)
Digital television customers 359.3 385.3 402.3 (26)(7)(17)(4)
Small Business - ILEC customers (c) 146.8 160.2 175.0 (13.4)(8)(14.8)(8)
(a) The decreases in the number of consumer households served in 2015 and 2014 were primarily attributable to the effects
of competition from wireless carriers, cable companies and other providers using emerging technologies.
(b) The decreases in consumer high-speed Internet customers in 2015 and 2014 were primarily due to the effects of competition
from other service providers and increased penetration in the marketplace, as the number of households without high-
speed Internet service continues to shrink. As of December 31, 2015, we provided high-speed Internet service to
approximately 76 percent of our primary residential lines in service and approximately 77 percent of our total voice lines
had high-speed Internet competition, primarily from cable service providers.
(c) The decreases in small business customers in 2015 and 2014 were primarily due to business closures and competition
from cable companies.
We expect the number of consumer households, consumer high-speed Internet customers, and small business customers in our
ILEC footprint to continue to be impacted by the effects of competition.
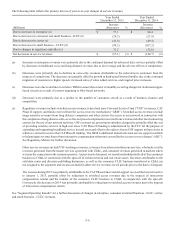
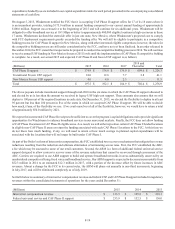
Carrier Segment Results of Operations
The following table reflects the carrier segment results of operations as of December 31:
2015 to 2014 2014 to 2013
(Millions) 2015 2014 2013
Increase
(Decrease) %
Increase
(Decrease) %
Revenues:
Core carrier (a) $ 543.4 $ 542.0 $ 545.1 $ 1.4 — $ (3.1)(1)
Wholesale (b) 80.5 81.7 85.6 (1.2)(1)(3.9)(5)
Total core carrier and wholesale 623.9 623.7 630.7 0.2 — (7)(1)
Wireless TDM (c) 64.0 106.0 148.4 (42.0)(40)(42.4)(29)
Total revenues 687.9 729.7 779.1 (41.8)(6)(49.4)(6)
Cost and expenses (d) 185.6 172.5 176.5 13.1 8 (4.0)(2)
Segment income $ 502.3 $ 557.2 $ 602.6 $ (54.9)(10) $ (45.4)(8)
(a) Core carrier revenues primarily include revenues from other carriers for special access circuits and fiber connections.
(b) Wholesale revenues represent voice and data services sold to other carriers on a wholesale basis.
(c) The decreases in these revenues were attributable to declines in special access charges for dedicated copper-based circuits
as carriers migrate to fiber-based networks. We expect these revenues to be adversely impacted as wireless carriers
continue to migrate traffic to fiber-based connections.
(d) The increase during 2015 was primarily related to higher interconnection expense due to an increase in long distance
usage by our wholesale customers. Comparatively, the decrease in 2014 reflected a reduction in interconnection expense
resulting from a decline in long distance usage partially offset by growth in interconnection costs due to increased purchases
of circuits and growth in data customers.