Windstream 2015 Annual Report Download - page 140
Download and view the complete annual report
Please find page 140 of the 2015 Windstream annual report below. You can navigate through the pages in the report by either clicking on the pages listed below, or by using the keyword search tool below to find specific information within the annual report.-
 1
1 -
2
-
3
-
4
-
5
-
6
-
7
-
8
-
9
-
10
-
11
-
12
-
13
-
14
-
15
-
16
-
17
-
18
-
19
-
20
-
21
-
22
-
23
-
24
-
25
-
26
-
27
-
28
-
29
-
30
-
31
-
32
-
33
-
34
-
35
-
36
-
37
-
38
-
39
-
40
-
41
-
42
-
43
-
44
-
45
-
46
-
47
-
48
-
49
-
50
-
51
-
52
-
53
-
54
-
55
-
56
-
57
-
58
-
59
-
60
-
61
-
62
-
63
-
64
-
65
-
66
-
67
-
68
-
69
-
70
-
71
-
72
-
73
-
74
-
75
-
76
-
77
-
78
-
79
-
80
-
81
-
82
-
83
-
84
-
85
-
86
-
87
-
88
-
89
-
90
-
91
-
92
-
93
-
94
-
95
-
96
-
97
-
98
-
99
-
100
-
101
-
102
-
103
-
104
-
105
-
106
-
107
-
108
-
109
-
110
-
111
-
112
-
113
-
114
-
115
-
116
-
117
-
118
-
119
-
120
-
121
-
122
-
123
-
124
-
125
-
126
-
127
-
128
-
129
-
 130
130 -
 131
131 -
 132
132 -
 133
133 -
 134
134 -
 135
135 -
 136
136 -
 137
137 -
 138
138 -
 139
139 -
 140
140 -
 141
141 -
 142
142 -
 143
143 -
 144
144 -
 145
145 -
 146
146 -
 147
147 -
 148
148 -
 149
149 -
 150
150 -
151
-
152
-
153
-
154
-
155
-
156
-
157
-
158
-
159
-
160
-
161
-
162
-
163
-
164
-
165
-
166
-
167
-
168
-
169
-
170
-
171
-
172
-
173
-
174
-
175
-
176
-
177
-
178
-
179
-
180
-
181
-
182
-
183
-
184
-
185
-
186
-
187
-
188
-
189
-
190
-
191
-
192
-
193
-
194
-
195
-
196
-
197
-
198
-
199
-
200
-
201
-
202
-
203
-
204
-
205
-
206
-
207
-
208
-
209
-
210
-
211
-
212
-
213
-
214
-
215
-
216
-
217
-
218
-
219
-
220
-
221
-
222
-
223
-
224
-
225
-
226
-
227
-
228
-
229
-
230
-
231
-
232
 |
 |

F-10
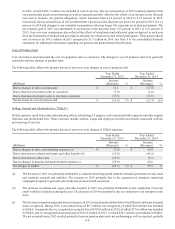
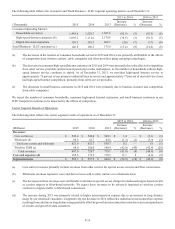
Set forth below is a summary of restructuring and merger and integration costs for the years ended December 31:
(Millions) 2015 2014 2013
Merger and integration costs:
Information technology conversion costs (a) $ 7.5 $ 20.8 $ 17.3
Costs related to REIT spin-off 65.1 15.5 —
Costs related to sale of data center business 10.3 — —
Network optimization and conversion costs 5.9 — —
Consulting and other costs (b) 6.2 4.1 12.9
Total merger and integration costs 95.0 40.4 30.2
Restructuring charges (c) 20.7 35.9 8.6
Total merger, integration and restructuring charges $ 115.7 $ 76.3 $ 38.8
(a) Information technology conversion costs incurred primarily consisted of redundant IT platform integrations designed to
improve processes and drive efficiencies.
(b) Consulting and other costs, during 2015, mostly consisted of consulting fees related to the sale of a substantial portion
of our data center business. In 2013, we incurred consulting fees related to network efficiency projects.
(c) Restructuring charges are primarily due to small workforce reductions completed during 2015, an early termination of a
software licensing agreement and the special shareholder meeting, as discussed above. In 2014, restructuring charges
primarily relate to the workforce reduction completed in the first quarter of 2014, also discussed above, as well as other
restructuring activities. In 2013, we incurred charges related to a voluntary workforce reduction initiated to better align
our focus on enterprise customer opportunities.
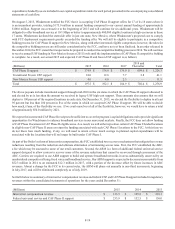
Summary of Liability Activity Related to Both Merger and Integration Costs and Restructuring Charges
As of December 31, 2015, we had unpaid merger, integration and restructuring liabilities totaling $5.1 million, which consisted
of $2.6 million associated with the restructuring initiatives and $2.5 million related to merger and integration activities, which are
included in other current liabilities in the accompanying consolidated balance sheet. Payments of these liabilities will be funded
through operating cash flows (see Note 10).
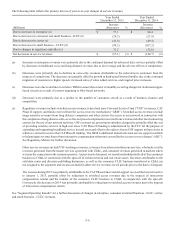
Operating Income
Operating income increased $2.3 million in 2015 primarily due to the differences in the amount of net actuarial losses and curtailment
and settlement gains recognized in pension and postretirement expense compared to 2014, incremental CAF Phase II revenues
received in the second half of 2015, and growth in enterprise revenues, reflecting continued demand for advanced data services.
These increases were partially offset by an increase in interconnection costs, transaction costs related to the REIT spin-off and
sale of the data center business and reductions in small business - CLEC and carrier revenues due to customer losses from business
closures and competition and declining demand for copper-based circuits, respectively. In 2014, operating income decreased $501.9
million, or 50 percent. The decrease was primarily due to reductions in consumer, carrier and regulatory revenues as a result of
continued voice line losses, declining demand for dedicated copper-based circuits, and the adverse effects of intercarrier
compensation reform, respectively. Higher sales and marketing expenses attributable to our brand awareness initiatives,
restructuring costs related to workforce reductions and additional depreciation expense resulting from additions to property, plant
and equipment also contributed to the declines in operating income in 2014.