Windstream 2015 Annual Report Download - page 139
Download and view the complete annual report
Please find page 139 of the 2015 Windstream annual report below. You can navigate through the pages in the report by either clicking on the pages listed below, or by using the keyword search tool below to find specific information within the annual report.-
 1
1 -
2
-
3
-
4
-
5
-
6
-
7
-
8
-
9
-
10
-
11
-
12
-
13
-
14
-
15
-
16
-
17
-
18
-
19
-
20
-
21
-
22
-
23
-
24
-
25
-
26
-
27
-
28
-
29
-
30
-
31
-
32
-
33
-
34
-
35
-
36
-
37
-
38
-
39
-
40
-
41
-
42
-
43
-
44
-
45
-
46
-
47
-
48
-
49
-
50
-
51
-
52
-
53
-
54
-
55
-
56
-
57
-
58
-
59
-
60
-
61
-
62
-
63
-
64
-
65
-
66
-
67
-
68
-
69
-
70
-
71
-
72
-
73
-
74
-
75
-
76
-
77
-
78
-
79
-
80
-
81
-
82
-
83
-
84
-
85
-
86
-
87
-
88
-
89
-
90
-
91
-
92
-
93
-
94
-
95
-
96
-
97
-
98
-
99
-
100
-
101
-
102
-
103
-
104
-
105
-
106
-
107
-
108
-
109
-
110
-
111
-
112
-
113
-
114
-
115
-
116
-
117
-
118
-
119
-
120
-
121
-
122
-
123
-
124
-
125
-
126
-
127
-
128
-
 129
129 -
 130
130 -
 131
131 -
 132
132 -
 133
133 -
 134
134 -
 135
135 -
 136
136 -
 137
137 -
 138
138 -
 139
139 -
 140
140 -
 141
141 -
 142
142 -
 143
143 -
 144
144 -
 145
145 -
 146
146 -
 147
147 -
 148
148 -
 149
149 -
150
-
151
-
152
-
153
-
154
-
155
-
156
-
157
-
158
-
159
-
160
-
161
-
162
-
163
-
164
-
165
-
166
-
167
-
168
-
169
-
170
-
171
-
172
-
173
-
174
-
175
-
176
-
177
-
178
-
179
-
180
-
181
-
182
-
183
-
184
-
185
-
186
-
187
-
188
-
189
-
190
-
191
-
192
-
193
-
194
-
195
-
196
-
197
-
198
-
199
-
200
-
201
-
202
-
203
-
204
-
205
-
206
-
207
-
208
-
209
-
210
-
211
-
212
-
213
-
214
-
215
-
216
-
217
-
218
-
219
-
220
-
221
-
222
-
223
-
224
-
225
-
226
-
227
-
228
-
229
-
230
-
231
-
232
 |
 |

F-9
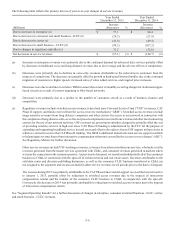
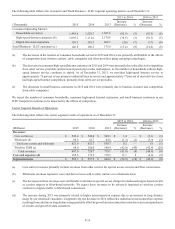
offset by the effects of an increase in the discount rate used to measure our pension obligations, which increased from
4.14 percent in 2014 to 4.55 percent in 2015. Conversely, the net actuarial loss in 2014 resulted from a decrease in the
discount rate from 5.01 percent in 2013 to 4.14 percent in 2014 and changes to our mortality assumptions reflecting longer
life expectancies of plan participants. The net actuarial gain in 2013 was attributable to an increase in the discount from
3.85 percent in 2012 to 5.01 percent in 2013. Year-over-year comparisons also reflected the effects of curtailment and
settlement gains recognized from the elimination of medical and prescription subsidies for certain active and retired
participants. These gains reduced SG&A by $3.7 million in 2015 compared to $4.4 million in 2014. See Note 8 to the
consolidated financial statements for additional information regarding our pension and postretirement benefit plans.
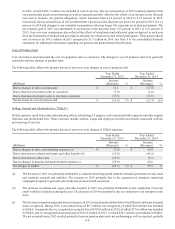
Depreciation and Amortization Expense
Depreciation and amortization expense includes the depreciation of property, plant and equipment and the amortization of intangible
assets.
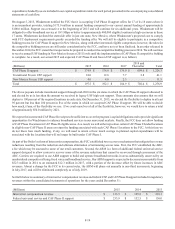
The following table reflects the primary drivers of year-over-year changes in depreciation and amortization expense:
Year Ended
December 31, 2015
Year Ended
December 31, 2014
(Millions)
Increase
(Decrease) %
Increase
(Decrease) %
Due to increases in depreciation expense (a) $ 16.0 $ 80.5
Due to decreases in amortization expense (b) (35.9)(35.0)
Net changes in depreciation and amortization expense $ (19.9)(1) $ 45.5 3
(a) Increases in depreciation expense were primarily due to additions to property, plant and equipment.
(b) Decreases in amortization expense reflected the use of the sum-of-the-years-digits method for customer lists. The effect
of using an accelerated amortization method results in incremental declines in expense each year as the intangible assets
amortize.
Merger, Integration and Restructuring Costs
We incur costs to complete a merger or acquisition and integrate its operations into our business, which are presented as merger
and integration expense in our consolidated results of operations. These costs include transaction costs, such as accounting, legal
and broker fees; severance and related costs; IT and network conversion; rebranding; and consulting fees. We also incurred
investment banking fees, legal, accounting and other consulting fees related to the REIT spin-off and the sale of a portion of our
data center business. During the fourth quarter of 2015, we began a network optimization project designed to consolidate traffic
onto network facilities operated by us and reduce the usage of other carriers’ networks, including service areas acquired in the
PAETEC acquisition. In undertaking this initiative, which we expect to complete during 2016, we incurred costs to migrate traffic
to lower cost circuits and to terminate existing contracts prior to their expiration. The PAETEC acquisition and costs related to
the spin-off and sale of our data center business account for the merger and integration costs incurred for the periods presented.
Restructuring charges are primarily incurred as a result of evaluations of our operating structure. Among other things, these
evaluations explore opportunities to provide greater flexibility in managing and financing existing and future strategic operations,
for task automation and the balancing of our workforce based on the current needs of our customers. Severance, lease exit costs
and other related charges are included in restructuring charges.
During 2015, we incurred restructuring charges of $15.6 million related to the completion of several small workforce reductions.
Additionally, we incurred charges of $3.1 million related to the special shareholder meeting held on February 20, 2015 to approve
the one-for-six reverse stock split and the conversion of Windstream Corporation to Windstream Services.
During 2014, we completed two workforce reductions to increase operational efficiency by eliminating a total of approximately
750 positions, including 295 resulting from voluntary separation initiatives. We also completed several smaller workforce reductions
throughout the year. In connection with these workforce reductions, we incurred pre-tax restructuring charges of $24.1 million
during 2014, primarily consisting of severance and other employee benefit costs. As a result of certain changes in our executive
management team, we also incurred severance-related costs of $6.3 million in 2014.