Yahoo 2014 Annual Report Download - page 151
Download and view the complete annual report
Please find page 151 of the 2014 Yahoo annual report below. You can navigate through the pages in the report by either clicking on the pages listed below, or by using the keyword search tool below to find specific information within the annual report.-
 1
1 -
2
-
3
-
4
-
5
-
6
-
7
-
8
-
9
-
10
-
11
-
12
-
13
-
14
-
15
-
16
-
17
-
18
-
19
-
20
-
21
-
22
-
23
-
24
-
25
-
26
-
27
-
28
-
29
-
30
-
31
-
32
-
33
-
34
-
35
-
36
-
37
-
38
-
39
-
40
-
41
-
42
-
43
-
44
-
45
-
46
-
47
-
48
-
49
-
50
-
51
-
52
-
53
-
54
-
55
-
56
-
57
-
58
-
59
-
60
-
61
-
62
-
63
-
64
-
65
-
66
-
67
-
68
-
69
-
70
-
71
-
72
-
73
-
74
-
75
-
76
-
77
-
78
-
79
-
80
-
81
-
82
-
83
-
84
-
85
-
86
-
87
-
88
-
89
-
90
-
91
-
92
-
93
-
94
-
95
-
96
-
97
-
98
-
99
-
100
-
101
-
102
-
103
-
104
-
105
-
106
-
107
-
108
-
109
-
110
-
111
-
112
-
113
-
114
-
115
-
116
-
117
-
118
-
119
-
120
-
121
-
122
-
123
-
124
-
125
-
126
-
127
-
128
-
129
-
130
-
131
-
132
-
133
-
134
-
135
-
136
-
137
-
138
-
139
-
140
-
 141
141 -
 142
142 -
 143
143 -
 144
144 -
 145
145 -
 146
146 -
 147
147 -
 148
148 -
 149
149 -
 150
150 -
 151
151 -
 152
152 -
 153
153 -
 154
154 -
 155
155 -
 156
156 -
 157
157 -
 158
158 -
 159
159 -
 160
160 -
 161
161 -
162
-
163
-
164
-
165
-
166
-
167
-
168
-
169
-
170
-
171
-
172
-
173
-
174
-
175
-
176
-
177
-
178
 |
 |

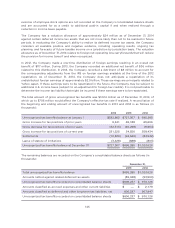
Note 18 Segments
The Company continues to manage its business geographically. The primary areas of measurement
and decision-making are Americas, EMEA (Europe, Middle East and Africa) and Asia Pacific.
Management relies on an internal reporting process that provides revenue ex-TAC, which is defined
as revenue less TAC, direct costs excluding TAC by segment, and consolidated income from
operations for making decisions related to the evaluation of the financial performance of, and
allocating resources to, the Company’s segments.
The following tables present summarized information by segment (in thousands):
Years Ended December 31,
2012 2013 2014
Revenue by segment:
Americas
$3,461,633 $3,481,502 $3,517,861
EMEA
472,061 385,186 374,833
Asia Pacific
1,052,872 813,692 725,439
Total Revenue
4,986,566 4,680,380 4,618,133
TAC by segment:
Americas
182,511 158,974 166,545
EMEA
114,230 42,915 36,867
Asia Pacific
222,165 52,553 14,119
Total TAC
518,906 254,442 217,531
Revenue ex-TAC by segment:
Americas
3,279,122 3,322,528 3,351,316
EMEA
357,831 342,271 337,966
Asia Pacific
830,707 761,139 711,320
Total Revenue ex-TAC
4,467,660 4,425,938 4,400,602
Direct costs by segment(1):
Americas
300,004 194,394 199,612
EMEA
95,632 88,534 86,225
Asia Pacific
181,632 196,832 198,806
Global operating costs(2)(3)
2,214,222 2,461,883 2,652,305
Depreciation and amortization
649,267 628,778 606,568
Goodwill impairment charge
— 63,555 88,414
Gains on sales of patents
— (79,950) (97,894)
Stock-based compensation expense
224,365 278,220 420,174
Restructuring charges, net
236,170 3,766 103,450
Income from operations
$ 566,368 $ 589,926 $ 142,942
(1) Direct costs for each segment include certain cost of revenue-other and costs associated with
the local sales teams. Prior to the fourth quarter of 2014, marketing, media, costs associated
147