Yahoo 2014 Annual Report Download - page 90
Download and view the complete annual report
Please find page 90 of the 2014 Yahoo annual report below. You can navigate through the pages in the report by either clicking on the pages listed below, or by using the keyword search tool below to find specific information within the annual report.-
 1
1 -
2
-
3
-
4
-
5
-
6
-
7
-
8
-
9
-
10
-
11
-
12
-
13
-
14
-
15
-
16
-
17
-
18
-
19
-
20
-
21
-
22
-
23
-
24
-
25
-
26
-
27
-
28
-
29
-
30
-
31
-
32
-
33
-
34
-
35
-
36
-
37
-
38
-
39
-
40
-
41
-
42
-
43
-
44
-
45
-
46
-
47
-
48
-
49
-
50
-
51
-
52
-
53
-
54
-
55
-
56
-
57
-
58
-
59
-
60
-
61
-
62
-
63
-
64
-
65
-
66
-
67
-
68
-
69
-
70
-
71
-
72
-
73
-
74
-
75
-
76
-
77
-
78
-
79
-
 80
80 -
 81
81 -
 82
82 -
 83
83 -
 84
84 -
 85
85 -
 86
86 -
 87
87 -
 88
88 -
 89
89 -
 90
90 -
 91
91 -
 92
92 -
 93
93 -
 94
94 -
 95
95 -
 96
96 -
 97
97 -
 98
98 -
 99
99 -
 100
100 -
101
-
102
-
103
-
104
-
105
-
106
-
107
-
108
-
109
-
110
-
111
-
112
-
113
-
114
-
115
-
116
-
117
-
118
-
119
-
120
-
121
-
122
-
123
-
124
-
125
-
126
-
127
-
128
-
129
-
130
-
131
-
132
-
133
-
134
-
135
-
136
-
137
-
138
-
139
-
140
-
141
-
142
-
143
-
144
-
145
-
146
-
147
-
148
-
149
-
150
-
151
-
152
-
153
-
154
-
155
-
156
-
157
-
158
-
159
-
160
-
161
-
162
-
163
-
164
-
165
-
166
-
167
-
168
-
169
-
170
-
171
-
172
-
173
-
174
-
175
-
176
-
177
-
178
 |
 |

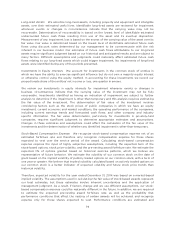
Yahoo! Inc.
Consolidated Statements of Income
Years Ended December 31,
2012 2013 2014
(in thousands, except per share amounts)
Revenue
$ 4,986,566 $4,680,380 $ 4,618,133
Operating expenses:
Cost of revenue—traffic acquisition costs
518,906 254,442 217,531
Cost of revenue—other
1,101,660 1,094,938 1,080,783
Sales and marketing
1,101,572 1,130,820 1,234,268
Product development
885,824 1,008,487 1,207,146
General and administrative
540,247 569,555 574,743
Amortization of intangibles
35,819 44,841 66,750
Gains on sales of patents
— (79,950) (97,894)
Goodwill impairment charge
— 63,555 88,414
Restructuring charges, net
236,170 3,766 103,450
Total operating expenses
4,420,198 4,090,454 4,475,191
Income from operations
566,368 589,926 142,942
Other income, net
4,647,839 43,357 10,369,439
Income before income taxes and earnings in equity
interests
5,214,207 633,283 10,512,381
Provision for income taxes
(1,940,043) (153,392) (4,038,102)
Earnings in equity interests, net of tax
676,438 896,675 1,057,863
Net income
3,950,602 1,376,566 7,532,142
Net income attributable to noncontrolling interests
(5,123) (10,285) (10,411)
Net income attributable to Yahoo! Inc.
$ 3,945,479 $1,366,281 $ 7,521,731
Net income attributable to Yahoo! Inc. common
stockholders per share—basic
$ 3.31 $ 1.30 $ 7.61
Net income attributable to Yahoo! Inc. common
stockholders per share—diluted
$ 3.28 $ 1.26 $ 7.45
Shares used in per share calculation—basic
1,192,775 1,052,705 987,819
Shares used in per share calculation—diluted
1,202,906 1,070,811 1,004,108
Stock-based compensation expense by function:
Cost of revenue—other
$ 10,078 $ 15,545 $ 33,560
Sales and marketing
82,115 101,852 154,372
Product development
74,284 83,396 139,056
General and administrative
57,888 77,427 93,186
Restructuring reversals, net
(3,429) — —
The accompanying notes are an integral part of these consolidated financial statements.
86