Yahoo 2014 Annual Report Download - page 157
Download and view the complete annual report
Please find page 157 of the 2014 Yahoo annual report below. You can navigate through the pages in the report by either clicking on the pages listed below, or by using the keyword search tool below to find specific information within the annual report.-
 1
1 -
2
-
3
-
4
-
5
-
6
-
7
-
8
-
9
-
10
-
11
-
12
-
13
-
14
-
15
-
16
-
17
-
18
-
19
-
20
-
21
-
22
-
23
-
24
-
25
-
26
-
27
-
28
-
29
-
30
-
31
-
32
-
33
-
34
-
35
-
36
-
37
-
38
-
39
-
40
-
41
-
42
-
43
-
44
-
45
-
46
-
47
-
48
-
49
-
50
-
51
-
52
-
53
-
54
-
55
-
56
-
57
-
58
-
59
-
60
-
61
-
62
-
63
-
64
-
65
-
66
-
67
-
68
-
69
-
70
-
71
-
72
-
73
-
74
-
75
-
76
-
77
-
78
-
79
-
80
-
81
-
82
-
83
-
84
-
85
-
86
-
87
-
88
-
89
-
90
-
91
-
92
-
93
-
94
-
95
-
96
-
97
-
98
-
99
-
100
-
101
-
102
-
103
-
104
-
105
-
106
-
107
-
108
-
109
-
110
-
111
-
112
-
113
-
114
-
115
-
116
-
117
-
118
-
119
-
120
-
121
-
122
-
123
-
124
-
125
-
126
-
127
-
128
-
129
-
130
-
131
-
132
-
133
-
134
-
135
-
136
-
137
-
138
-
139
-
140
-
141
-
142
-
143
-
144
-
145
-
146
-
 147
147 -
 148
148 -
 149
149 -
 150
150 -
 151
151 -
 152
152 -
 153
153 -
 154
154 -
 155
155 -
 156
156 -
 157
157 -
 158
158 -
 159
159 -
 160
160 -
 161
161 -
 162
162 -
 163
163 -
 164
164 -
 165
165 -
 166
166 -
 167
167 -
168
-
169
-
170
-
171
-
172
-
173
-
174
-
175
-
176
-
177
-
178
 |
 |

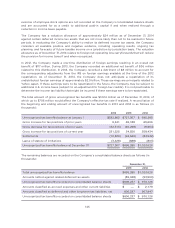
Selected Quarterly Financial Data
(Unaudited)
Quarters Ended
March 31,
2013(1)
June 30,
2013(2)
September 30,
2013(3)
December 31,
2013(4)
March 31,
2014(5)
June 30,
2014(6)
September 30,
2014(7)
December 31,
2014(8)
(In thousands, except per share amounts)
Revenue
$1,140,368 $1,135,244 $1,138,973 $1,265,795 $1,132,730 $1,084,191 $ 1,148,140 $1,253,072
Total
operating
expenses
$ 954,398 $ 998,265 $1,046,214 $1,091,577 $1,102,551 $1,045,754 $ 1,105,968 $1,220,918
Income from
operations
$ 185,970 $ 136,979 $ 92,759 $ 174,218 $ 30,179 $ 38,437 $ 42,172 $ 32,154
Other income
(expense),
net
$ 17,072 $ 23,606 $ 5,370 $ (2,691) $ (13,453) $ (13,589) $10,308,931 $ 87,550
Provision for
income taxes
$ (29,736) $ (50,267) $ (31,891) $ (41,498) $ (4,217) $ (8,143) $ (3,973,402) $ (52,340)
Earnings in
equity
interests
$ 217,588 $ 224,690 $ 232,756 $ 221,641 $ 301,402 $ 255,852 $ 398,692 $ 101,917
Net income
attributable
to Yahoo! Inc.
$ 390,285 $ 331,150 $ 296,656 $ 348,190 $ 311,578 $ 269,707 $ 6,774,102 $ 166,344
Net income
attributable
to Yahoo! Inc.
common
stockholders
per share—
basic
$ 0.36 $ 0.31 $ 0.29 $ 0.34 $ 0.31 $ 0.27 $ 6.82 $ 0.18
Net income
attributable
to Yahoo! Inc.
common
stockholders
per share—
diluted
$ 0.35 $ 0.30 $ 0.28 $ 0.33 $ 0.29 $ 0.26 $ 6.70 $ 0.17
Shares used
in per share
calculation—
basic
1,094,170 1,079,389 1,024,289 1,012,972 1,009,890 999,765 993,543 948,079
Shares used
in per share
calculation—
diluted
1,108,095 1,094,694 1,041,698 1,038,754 1,031,420 1,014,692 1,007,693 962,626
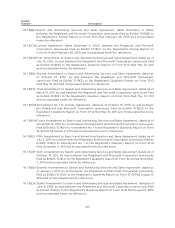
(1) Net income attributable to Yahoo! Inc. for the quarter ended March 31, 2013 includes net
restructuring reversals of $7 million.
(2) Net income attributable to Yahoo! Inc. for the quarter ended June 30, 2013 includes a gain on sales
of patents of $10 million and net restructuring charges of $4 million.
(3) Net income attributable to Yahoo! Inc. for the quarter ended September 30, 2013 includes net
restructuring reversals of less than $1 million.
(4) Net income attributable to Yahoo! Inc. for the quarter ended December 31, 2013 includes a gain on
sale of patents of $70 million, a goodwill impairment charge of $64 million, and net restructuring
charges of $8 million.
153