eBay 2009 Annual Report Download - page 111
Download and view the complete annual report
Please find page 111 of the 2009 eBay annual report below. You can navigate through the pages in the report by either clicking on the pages listed below, or by using the keyword search tool below to find specific information within the annual report.-
 1
1 -
2
-
3
-
4
-
5
-
6
-
7
-
8
-
9
-
10
-
11
-
12
-
13
-
14
-
15
-
16
-
17
-
18
-
19
-
20
-
21
-
22
-
23
-
24
-
25
-
26
-
27
-
28
-
29
-
30
-
31
-
32
-
33
-
34
-
35
-
36
-
37
-
38
-
39
-
40
-
41
-
42
-
43
-
44
-
45
-
46
-
47
-
48
-
49
-
50
-
51
-
52
-
53
-
54
-
55
-
56
-
57
-
58
-
59
-
60
-
61
-
62
-
63
-
64
-
65
-
66
-
67
-
68
-
69
-
70
-
71
-
72
-
73
-
74
-
75
-
76
-
77
-
78
-
79
-
80
-
81
-
82
-
83
-
84
-
85
-
86
-
87
-
88
-
89
-
90
-
91
-
92
-
93
-
94
-
95
-
96
-
97
-
98
-
99
-
100
-
 101
101 -
 102
102 -
 103
103 -
 104
104 -
 105
105 -
 106
106 -
 107
107 -
 108
108 -
 109
109 -
 110
110 -
 111
111 -
 112
112 -
 113
113 -
 114
114 -
 115
115 -
 116
116 -
 117
117 -
 118
118 -
 119
119 -
 120
120 -
 121
121 -
122
-
123
-
124
-
125
-
126
-
127
-
128
-
129
-
130
-
131
-
132
-
133
-
134
-
135
-
136
-
137
-
138
-
139
-
140
 |
 |

eBay Inc.
NOTES TO CONSOLIDATED FINANCIAL STATEMENTS—(Continued)
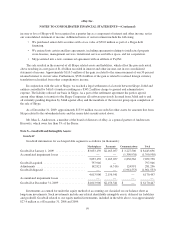
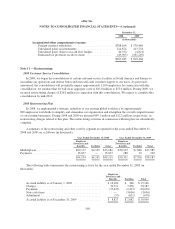
Note 7 — Investments:
At December 31, 2008 and 2009, the fair value of short and long-term investments classified as available for
sale are as follows (in thousands):
December 31, 2008
Gross
Amortized
Cost
Gross
Unrealized
Gains
Gross
Unrealized
Losses
Estimated
Fair Value
Short-term investments:
Restricted cash ..................................... $21,258 $ — $— $ 21,258
Corporate debt securities ............................. 5,000 — (2) 4,998
Time deposits and other .............................. 4,129 — — 4,129
Equity instruments .................................. 8,507 124,842 — 133,349
$38,894 $124,842 $ (2) $163,734
Long-term investments:
Restricted cash ..................................... $ 5,461 $ — $— $ 5,461
Time deposits and other .............................. 52 — — 52
$ 5,513 $ — $— $ 5,513
December 31, 2009
Gross
Amortized
Cost
Gross
Unrealized
Gains
Gross
Unrealized
Losses
Estimated
Fair Value
Short-term investments:
Restricted cash ..................................... $ 29,123 $ — $ — $ 29,123
Corporate debt securities ............................. 73,256 10 (126) 73,140
Government and agency securities ..................... 109,808 18 (19) 109,807
Time deposits and other ............................. 310,418 — — 310,418
Equity instruments .................................. 8,507 412,991 — 421,498
$531,112 $413,019 $ (145) $943,986
Long-term investments:
Restricted cash ..................................... $ 985 $ — $ — $ 985
Corporate debt securities ............................. 455,638 1,982 (437) 457,183
Government and agency securities ..................... 250,025 108 (773) 249,360
Time deposits and other ............................. 1,583 — — 1,583
$708,231 $ 2,090 $(1,210) $709,111
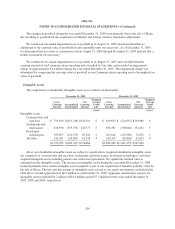
The following table summarizes the fair value and gross unrealized losses of our short-term and long-term
investments, aggregated by type of investment instrument and length of time that individual securities have been
in a continuous unrealized loss position, at December 31, 2009 (in thousands):
Less than 12 Months 12 Months or Greater Total
Fair Value
Gross
Unrealized
Losses Fair Value
Gross
Unrealized
Losses Fair Value
Gross
Unrealized
Losses
Corporate debt securities .............. $530,323 $ (563) $— $— $530,323 $ (563)
Government and agency securities ...... 359,167 (792) — — 359,167 (792)
$889,490 $(1,355) $— $— $889,490 $(1,355)
103