eBay 2009 Annual Report Download - page 124
Download and view the complete annual report
Please find page 124 of the 2009 eBay annual report below. You can navigate through the pages in the report by either clicking on the pages listed below, or by using the keyword search tool below to find specific information within the annual report.-
 1
1 -
2
-
3
-
4
-
5
-
6
-
7
-
8
-
9
-
10
-
11
-
12
-
13
-
14
-
15
-
16
-
17
-
18
-
19
-
20
-
21
-
22
-
23
-
24
-
25
-
26
-
27
-
28
-
29
-
30
-
31
-
32
-
33
-
34
-
35
-
36
-
37
-
38
-
39
-
40
-
41
-
42
-
43
-
44
-
45
-
46
-
47
-
48
-
49
-
50
-
51
-
52
-
53
-
54
-
55
-
56
-
57
-
58
-
59
-
60
-
61
-
62
-
63
-
64
-
65
-
66
-
67
-
68
-
69
-
70
-
71
-
72
-
73
-
74
-
75
-
76
-
77
-
78
-
79
-
80
-
81
-
82
-
83
-
84
-
85
-
86
-
87
-
88
-
89
-
90
-
91
-
92
-
93
-
94
-
95
-
96
-
97
-
98
-
99
-
100
-
101
-
102
-
103
-
104
-
105
-
106
-
107
-
108
-
109
-
110
-
111
-
112
-
113
-
 114
114 -
 115
115 -
 116
116 -
 117
117 -
 118
118 -
 119
119 -
 120
120 -
 121
121 -
 122
122 -
 123
123 -
 124
124 -
 125
125 -
 126
126 -
 127
127 -
 128
128 -
 129
129 -
 130
130 -
 131
131 -
 132
132 -
 133
133 -
 134
134 -
135
-
136
-
137
-
138
-
139
-
140
 |
 |

eBay Inc.
NOTES TO CONSOLIDATED FINANCIAL STATEMENTS—(Continued)
Stock-Based Compensation Expense
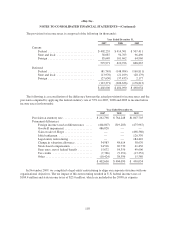
The following table presents details of total stock-based compensation expense that is included in each line
item on our consolidated statement of income (in thousands):
Year Ended December 31,
2007 2008 2009
Cost of net revenues ........................... $ 37,009 $ 43,417 $ 49,275
Sales and marketing ........................... 81,299 94,314 121,724
Product development .......................... 76,002 95,396 98,609
General and administrative ..................... 107,503 118,915 125,199
Restructuring ................................ — 1,281 —
Total stock-based compensation expense .......... $301,813 $353,323 $394,807
In general, the stock-based compensation expense for our equity incentive awards is recognized over their
respective vesting period. As of December 31, 2009, there was approximately $580.9 million of unearned stock-
based compensation estimated to be expensed from 2010 through 2013. If there are any modifications or
cancellations of the underlying unvested awards, we may be required to accelerate, increase or cancel all or a
portion of the remaining unearned stock-based compensation expense. Future unearned stock-based
compensation will increase to the extent we grant additional equity awards or change the mix of grants between
stock options and restricted stock units or assume unvested equity awards in connection with acquisitions.
Stock Option Activity
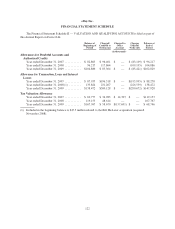
The following table summarizes stock option activity under our equity incentive plans as of and for the year
ended December 31, 2009 (in thousands, except per share amounts):
Shares
Weighted
Average
Exercise
Price
Weighted Average
Remaining
Contractual Term
(in years)
Aggregate
Intrinsic
Value
Outstanding at January 1, 2009 .......................... 116,060 $29.79
Granted and assumed .................................. 9,877 $13.24
Exercised ........................................... (6,080) $ 8.27
Options exchanged in connection with the stock option
exchange program .................................. (42,630) $37.43
Forfeited/expired/cancelled ............................. (23,179) $32.05
Outstanding at December 31, 2009 ....................... 54,048 $22.28 4.52 $292,128
Expected to vest at December 31, 2009 .................... 51,448 $22.62 4.41 $268,678
Options exercisable at December 31, 2009 ................. 36,429 $25.18 3.67 $137,545
The aggregate intrinsic value was calculated as the difference between the exercise price of the underlying
awards and the quoted price of our common stock. At December 31, 2009, options to purchase 25.7 million
shares of common stock were in-the-money.
The weighted average grant-date fair value of options granted during the years 2007, 2008 and 2009 was
$10.60, $7.46 and $4.59 respectively. During the years 2007, 2008 and 2009, the aggregate intrinsic value of
options exercised under our equity incentive plans was $402.4 million, $83.0 million and $69.7 million,
respectively, determined as of the date of option exercise.
116