eBay 2009 Annual Report Download - page 63
Download and view the complete annual report
Please find page 63 of the 2009 eBay annual report below. You can navigate through the pages in the report by either clicking on the pages listed below, or by using the keyword search tool below to find specific information within the annual report.-
 1
1 -
2
-
3
-
4
-
5
-
6
-
7
-
8
-
9
-
10
-
11
-
12
-
13
-
14
-
15
-
16
-
17
-
18
-
19
-
20
-
21
-
22
-
23
-
24
-
25
-
26
-
27
-
28
-
29
-
30
-
31
-
32
-
33
-
34
-
35
-
36
-
37
-
38
-
39
-
40
-
41
-
42
-
43
-
44
-
45
-
46
-
47
-
48
-
49
-
50
-
51
-
52
-
 53
53 -
 54
54 -
 55
55 -
 56
56 -
 57
57 -
 58
58 -
 59
59 -
 60
60 -
 61
61 -
 62
62 -
 63
63 -
 64
64 -
 65
65 -
 66
66 -
 67
67 -
 68
68 -
 69
69 -
 70
70 -
 71
71 -
 72
72 -
 73
73 -
74
-
75
-
76
-
77
-
78
-
79
-
80
-
81
-
82
-
83
-
84
-
85
-
86
-
87
-
88
-
89
-
90
-
91
-
92
-
93
-
94
-
95
-
96
-
97
-
98
-
99
-
100
-
101
-
102
-
103
-
104
-
105
-
106
-
107
-
108
-
109
-
110
-
111
-
112
-
113
-
114
-
115
-
116
-
117
-
118
-
119
-
120
-
121
-
122
-
123
-
124
-
125
-
126
-
127
-
128
-
129
-
130
-
131
-
132
-
133
-
134
-
135
-
136
-
137
-
138
-
139
-
140
 |
 |

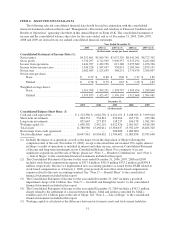
(2) Total value of all successfully closed items between users on eBay Marketplaces trading platforms during
the period, regardless of whether the buyer and seller actually consummated the transaction, excluding
vehicles gross merchandise volume.
(3) Total value of all successfully closed vehicle transactions between users on eBay Marketplaces trading
platforms during the period, regardless of whether the buyer and seller actually consummated the
transaction.
(4) Total value of all successfully closed items between users on eBay Marketplaces trading platforms during
the period, regardless of whether the buyer and seller actually consummated the transaction.
(5) Total dollar volume of payments, net of payment reversals, successfully completed through our Payments
network or on Bill Me Later accounts during the period, excluding PayPal’s payment gateway business.
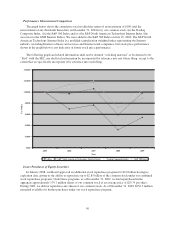
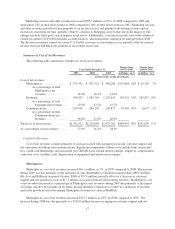
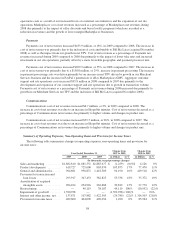
Seasonality
The following table sets forth, for the periods presented, our total net revenues and the sequential quarterly
growth of these net revenues.
Quarter Ended
March 31 June 30 September 30 December 31
(In thousands, except percentages)
2007
Net revenues ........................... $1,768,074 $1,834,429 $1,889,220 $2,180,606
Current quarter vs prior quarter ............ 3% 4% 3% 15%
2008
Net revenues ........................... $2,192,223 $2,195,661 $2,117,531 $2,035,846
Current quarter vs prior quarter ............ 1% 0% (4)% (4)%
2009
Net revenues ........................... $2,020,586 $2,097,992 $2,237,852 $2,370,932
Current quarter vs prior quarter ............ (1)% 4% 7% 6%
We expect transaction activity patterns on our websites to mirror general consumer buying patterns.
Marketplaces Net Transaction Revenues
Marketplaces net transaction revenues decreased $249.2 million, or 5%, in 2009 compared to 2008, while
GMV excluding vehicles increased 1% in 2009 compared to 2008. The decrease in net transaction revenues was
due primarily to the negative impact of foreign currency movements against the U.S. dollar; pricing initiatives,
including larger discounts given to our highest-rated sellers (recorded as a reduction in revenue); and a decline in
revenue generated from our vehicles category offset in part by the inclusion of revenue generated from Gmarket
(acquired June 2009).
Marketplaces net transaction revenues increased $30.2 million, or 1%, in 2008 compared to 2007. GMV
excluding vehicles increased 3% due primarily to an increase in Marketplaces’ second largest category,
consumer electronics. Although we achieved growth in the number of sold items on our eBay Marketplaces
trading platforms in 2008, the average selling price declined compared to 2007 primarily as a result of consumer
buying patterns in a weakening global economic environment. Expenditures for buyer incentive programs, which
are generally recorded as a reduction in revenue, reduced revenue growth by approximately 400 basis points in
2008. In addition, pricing discounts and changes had a negative impact on 2008 revenue growth.
Marketplaces net transaction revenues earned internationally were $2.4 billion in 2009 and $2.5 billion in
both 2008 and 2007, representing 55%, 54% and 53% of total Marketplaces net transaction revenues,
respectively.
55