eBay 2009 Annual Report Download - page 67
Download and view the complete annual report
Please find page 67 of the 2009 eBay annual report below. You can navigate through the pages in the report by either clicking on the pages listed below, or by using the keyword search tool below to find specific information within the annual report.-
 1
1 -
2
-
3
-
4
-
5
-
6
-
7
-
8
-
9
-
10
-
11
-
12
-
13
-
14
-
15
-
16
-
17
-
18
-
19
-
20
-
21
-
22
-
23
-
24
-
25
-
26
-
27
-
28
-
29
-
30
-
31
-
32
-
33
-
34
-
35
-
36
-
37
-
38
-
39
-
40
-
41
-
42
-
43
-
44
-
45
-
46
-
47
-
48
-
49
-
50
-
51
-
52
-
53
-
54
-
55
-
56
-
 57
57 -
 58
58 -
 59
59 -
 60
60 -
 61
61 -
 62
62 -
 63
63 -
 64
64 -
 65
65 -
 66
66 -
 67
67 -
 68
68 -
 69
69 -
 70
70 -
 71
71 -
 72
72 -
 73
73 -
 74
74 -
 75
75 -
 76
76 -
 77
77 -
78
-
79
-
80
-
81
-
82
-
83
-
84
-
85
-
86
-
87
-
88
-
89
-
90
-
91
-
92
-
93
-
94
-
95
-
96
-
97
-
98
-
99
-
100
-
101
-
102
-
103
-
104
-
105
-
106
-
107
-
108
-
109
-
110
-
111
-
112
-
113
-
114
-
115
-
116
-
117
-
118
-
119
-
120
-
121
-
122
-
123
-
124
-
125
-
126
-
127
-
128
-
129
-
130
-
131
-
132
-
133
-
134
-
135
-
136
-
137
-
138
-
139
-
140
 |
 |

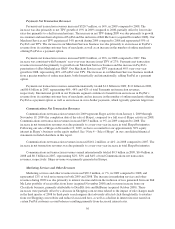
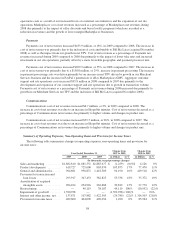
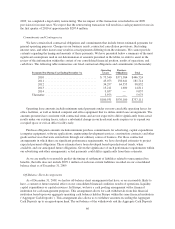
Sales and Marketing
2007 2008 2009
(In thousands, except percentages)
Sales and marketing ...................... $1,882,810 $1,881,551 $1,885,677
As a percentage of net revenues ............. 24.5% 22.0% 21.6%
Sales and marketing expenses consist primarily of advertising costs, marketing programs, employee
compensation, facilities costs and depreciation on equipment.
Sales and marketing expense increased by $4.1 million in 2009 compared to 2008, due primarily to the
inclusion of costs attributable to Gmarket (acquired June 2009), Bill Me Later (acquired November 2008) and
Den Blå Avis and BilBasen (acquired October 2008) of $97.6 million as well as an increases in employee related
expenses of $23.7 million and professional services costs of $10.2 million. The increases were partially offset by
a $126.6 million reduction in marketing programs as we continue to focus on customer retention (for which
certain associated expenses are recorded as a reduction in revenue instead of sales and marketing expense) rather
than customer acquisition.
Sales and marketing expenses decreased by $1.3 million in 2008 compared to 2007. We increased the use of
buyer and seller incentive programs (for which certain associated expenses are recorded as a reduction in revenue
instead of sales and marketing expense) as opposed to online and offline marketing programs as we shifted our
marketing focus from customer acquisition to customer retention. Marketing and advertising program costs
decreased approximately $100.4 million partially offset by an $87.7 million increase in employee-related costs
due to a net increase in staffing.
Sales and marketing expense as a percentage of net revenues decreased in 2009 and 2008 due to lower, more
targeted spending within our Marketplaces segment as well as the growth of our Payments and our former
Communications segments, each of which has lower relative sales and marketing expenses than our Marketplaces
segment.
Product Development
2007 2008 2009
(In thousands, except percentages)
Product development ...................... $619,727 $725,600 $803,070
As a percentage of net revenues ............. 8.1% 8.5% 9.2%
Product development expenses consist primarily of employee compensation, contractor costs, facilities costs
and depreciation on equipment. Product development expenses are net of required capitalization of major site and
other product development efforts, including the development of our next generation platform architecture,
migration of certain platforms, seller tools and Payments services projects. These capitalized costs totaled
$105.4 million in 2009, $112.7 million in 2008 and $110.6 million in 2007, and are primarily reflected as a cost
of net revenues when amortized in future periods.
Product development expenses increased by $77.5 million, or 11%, in 2009 compared to 2008. Product
development also increased as a percentage of revenue in 2009 compared to 2008. The increase in both dollars
and as a percentage of revenue was due primarily to an increase in employee-related and consultant costs driven
by increased investment in our top technology priorities: search, catalog, platform, and user experience.
Product development expenses increased $105.9 million, or 17%, in 2008 compared to 2007. The increase
was due primarily to an increase in staffing, consultant costs, facility costs and equipment related costs to support
59