eBay 2009 Annual Report Download - page 65
Download and view the complete annual report
Please find page 65 of the 2009 eBay annual report below. You can navigate through the pages in the report by either clicking on the pages listed below, or by using the keyword search tool below to find specific information within the annual report.-
 1
1 -
2
-
3
-
4
-
5
-
6
-
7
-
8
-
9
-
10
-
11
-
12
-
13
-
14
-
15
-
16
-
17
-
18
-
19
-
20
-
21
-
22
-
23
-
24
-
25
-
26
-
27
-
28
-
29
-
30
-
31
-
32
-
33
-
34
-
35
-
36
-
37
-
38
-
39
-
40
-
41
-
42
-
43
-
44
-
45
-
46
-
47
-
48
-
49
-
50
-
51
-
52
-
53
-
54
-
 55
55 -
 56
56 -
 57
57 -
 58
58 -
 59
59 -
 60
60 -
 61
61 -
 62
62 -
 63
63 -
 64
64 -
 65
65 -
 66
66 -
 67
67 -
 68
68 -
 69
69 -
 70
70 -
 71
71 -
 72
72 -
 73
73 -
 74
74 -
 75
75 -
76
-
77
-
78
-
79
-
80
-
81
-
82
-
83
-
84
-
85
-
86
-
87
-
88
-
89
-
90
-
91
-
92
-
93
-
94
-
95
-
96
-
97
-
98
-
99
-
100
-
101
-
102
-
103
-
104
-
105
-
106
-
107
-
108
-
109
-
110
-
111
-
112
-
113
-
114
-
115
-
116
-
117
-
118
-
119
-
120
-
121
-
122
-
123
-
124
-
125
-
126
-
127
-
128
-
129
-
130
-
131
-
132
-
133
-
134
-
135
-
136
-
137
-
138
-
139
-
140
 |
 |

Marketing services and other revenues increased $195.5 million, or 25%, in 2008 compared to 2007 and
represented 12% of total net revenues in 2008 compared to 10% of total net revenues in 2007. Marketing services
and other revenues growth was due primarily to an increase in text and graphical advertising revenue and an
increase in classifieds revenue, partially offset by a decline in Shopping.com revenue due to the impact of rule
changes made by third-party search engines noted above. Additionally, a decline in interest rates reduced interest
earned on certain U.S. PayPal customer account balances, which negatively impacted revenue growth in 2008.
The decrease in interest earned on certain U.S. PayPal customer account balances was partially offset by interest
income from our Bill Me Later portfolio of receivables from loans.
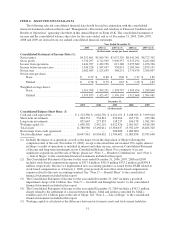
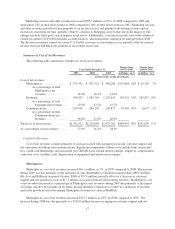
Summary of Cost of Net Revenues
The following table summarizes changes in cost of net revenues:
Year Ended December 31,
Change from
2007 to 2008
Change from
2008 to 2009
2007 2008 2009 in Dollars in % in Dollars in %
(In thousands, except percentages)
Cost of net revenues:
Marketplaces ................ $ 771,452 $ 907,121 $ 968,266 $135,669 18% $ 61,145 7%
As a percentage of total
Marketplaces net
revenues .............. 14.4% 16.2% 18.2%
Payments ................... 766,825 1,036,746 1,220,619 269,921 35% 183,873 18%
As a percentage of total
Payments net revenues . . 39.8% 43.1% 43.7%
Communications ............. 224,695 284,202 290,877 59,507 26% 6,675 2%
As a percentage of total
Communications net
revenues .............. 58.8% 51.6% 46.9%
Total cost of net revenues .......... $1,762,972 $2,228,069 $2,479,762 $465,097 26% $251,693 11%
As a percentage of net revenues ..... 23.0% 26.1% 28.4%
Cost of Net Revenues
Cost of net revenues consists primarily of costs associated with payment processing, customer support and
site operations and Skype telecommunications. Significant components of these costs include bank transaction
fees, credit card interchange and assessment fees, Bill Me Later related interest charges, employee compensation,
contractor costs, facilities costs, depreciation of equipment and amortization expense.
Marketplaces
Marketplaces cost of net revenues increased $61.1 million, or 7%, in 2009 compared to 2008. The increase
during 2009 was due primarily to the inclusion of costs attributable to Gmarket (acquired June 2009) and Den
Blå Avis and BilBasen (acquired October 2008) of $77.4 million, partially offset by a decrease in customer
support and site operations costs of $17.2 million associated with our restructuring activities. Marketplaces cost
of net revenues increased as a percentage of Marketplaces net revenues during 2009 due primarily to the impact
of foreign currency movements on revenues, pricing initiatives (which are recorded as a reduction in revenue)
and faster growth in our lower margin Marketplaces businesses, such as StubHub.
Marketplaces cost of net revenues increased $135.7 million, or 18%, in 2008 compared to 2007. The
increase during 2008 was due primarily to a $110.0 million increase in aggregate customer support and site
57