eBay 2009 Annual Report Download - page 58
Download and view the complete annual report
Please find page 58 of the 2009 eBay annual report below. You can navigate through the pages in the report by either clicking on the pages listed below, or by using the keyword search tool below to find specific information within the annual report.-
 1
1 -
2
-
3
-
4
-
5
-
6
-
7
-
8
-
9
-
10
-
11
-
12
-
13
-
14
-
15
-
16
-
17
-
18
-
19
-
20
-
21
-
22
-
23
-
24
-
25
-
26
-
27
-
28
-
29
-
30
-
31
-
32
-
33
-
34
-
35
-
36
-
37
-
38
-
39
-
40
-
41
-
42
-
43
-
44
-
45
-
46
-
47
-
 48
48 -
 49
49 -
 50
50 -
 51
51 -
 52
52 -
 53
53 -
 54
54 -
 55
55 -
 56
56 -
 57
57 -
 58
58 -
 59
59 -
 60
60 -
 61
61 -
 62
62 -
 63
63 -
 64
64 -
 65
65 -
 66
66 -
 67
67 -
 68
68 -
69
-
70
-
71
-
72
-
73
-
74
-
75
-
76
-
77
-
78
-
79
-
80
-
81
-
82
-
83
-
84
-
85
-
86
-
87
-
88
-
89
-
90
-
91
-
92
-
93
-
94
-
95
-
96
-
97
-
98
-
99
-
100
-
101
-
102
-
103
-
104
-
105
-
106
-
107
-
108
-
109
-
110
-
111
-
112
-
113
-
114
-
115
-
116
-
117
-
118
-
119
-
120
-
121
-
122
-
123
-
124
-
125
-
126
-
127
-
128
-
129
-
130
-
131
-
132
-
133
-
134
-
135
-
136
-
137
-
138
-
139
-
140
 |
 |

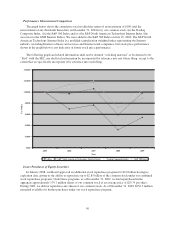
Performance Measurement Comparison
The graph below shows the cumulative total stockholder return of an investment of $100 (and the
reinvestment of any dividends thereafter) on December 31, 2004 in (i) our common stock, (ii) the Nasdaq
Composite Index, (iii) the S&P 500 Index and (iv) the S&P North American Technology Internet Index (the
successor to the GSTI Internet Index). We were added to the S&P 500 Index on July 19, 2002. The S&P North
American Technology Internet Index is a modified-capitalization weighted index representing the Internet
industry, including Internet software and services and Internet retail companies. Our stock price performance
shown in the graph below is not indicative of future stock price performance.
The following graph and related information shall not be deemed “soliciting material” or be deemed to be
“filed” with the SEC, nor shall such information be incorporated by reference into any future filing, except to the
extent that we specifically incorporate it by reference into such filing.
$0.00
$20.00
$40.00
$60.00
$80.00
$100.00
$120.00
$140.00
2009
Year
U.S. Dollar
eBay S&P North American Technology Internet Index Nasdaq Composite Index S&P 500 Index
2005 2006 2007 2008
Issuer Purchases of Equity Securities
In January 2008, our Board approved an additional stock repurchase program for $2.0 billion having no
expiration date, giving us the ability to repurchase up to $2.85 billion of the common stock under our combined
stock repurchase programs. Under these programs, as of December 31, 2009, we had repurchased in the
aggregate approximately 179.7 million shares of our common stock at an average price of $29.74 per share.
During 2009, we did not repurchase any shares of our common stock. As of December 31, 2009, $656.5 million
remained available for further purchases under our stock repurchase program.
50