eBay 2015 Annual Report Download - page 115
Download and view the complete annual report
Please find page 115 of the 2015 eBay annual report below. You can navigate through the pages in the report by either clicking on the pages listed below, or by using the keyword search tool below to find specific information within the annual report.-
 1
1 -
2
-
3
-
4
-
5
-
6
-
7
-
8
-
9
-
10
-
11
-
12
-
13
-
14
-
15
-
16
-
17
-
18
-
19
-
20
-
21
-
22
-
23
-
24
-
25
-
26
-
27
-
28
-
29
-
30
-
31
-
32
-
33
-
34
-
35
-
36
-
37
-
38
-
39
-
40
-
41
-
42
-
43
-
44
-
45
-
46
-
47
-
48
-
49
-
50
-
51
-
52
-
53
-
54
-
55
-
56
-
57
-
58
-
59
-
60
-
61
-
62
-
63
-
64
-
65
-
66
-
67
-
68
-
69
-
70
-
71
-
72
-
73
-
74
-
75
-
76
-
77
-
78
-
79
-
80
-
81
-
82
-
83
-
84
-
85
-
86
-
87
-
88
-
89
-
90
-
91
-
92
-
93
-
94
-
95
-
96
-
97
-
98
-
99
-
100
-
101
-
102
-
103
-
104
-
 105
105 -
 106
106 -
 107
107 -
 108
108 -
 109
109 -
 110
110 -
 111
111 -
 112
112 -
 113
113 -
 114
114 -
 115
115 -
 116
116 -
 117
117 -
 118
118 -
 119
119 -
 120
120 -
 121
121 -
 122
122 -
 123
123 -
 124
124 -
 125
125 -
126
-
127
-
128
-
129
-
130
-
131
-
132
-
133
-
134
-
135
-
136
 |
 |

eBay Inc.
NOTES TO CONSOLIDATED FINANCIAL STATEMENTS — (Continued)
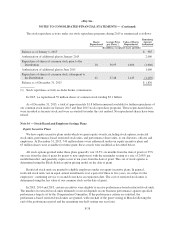
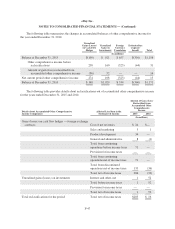
Restricted Stock Unit Activity
A summary of the status of restricted stock units (“RSU”) granted (including performance-based restricted
stock units that have been earned) under our equity incentive plans as of December 31, 2015 and changes during
the year ended December 31, 2015 is presented below:
Units
Weighted Average
Grant-Date Fair
Value (per share)
(In millions, except per share amounts)
Outstanding as of January 1, 2015 36 $50.21
Awarded and assumed 19 $53.67(1)
Vested (14) $39.42(1)
Forfeited (15) $31.18(1)
Adjustment due to the Distribution 10
Outstanding as of December 31, 2015 36 $22.50
Expected to vest at December 31, 2015 29
(1) Weighted average grant date fair value is calculated using grant date fair value prior to the Distribution and
after the Distribution.
During the years 2015, 2014 and 2013, the aggregate intrinsic value of restricted stock units vested under
our equity incentive plans was $697 million, $759 million and $813 million, respectively.
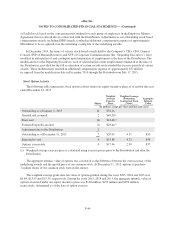
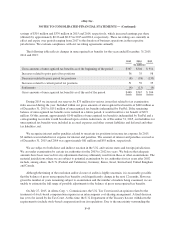
Stock-based Compensation Expense
The impact on our results of operations of recording stock-based compensation expense for years ended
December 31, 2015, 2014 and 2013 was as follows:
Year Ended December 31,
2015 2014 2013
(In millions)
Cost of net revenues $ 38 $ 33 $ 27
Sales and marketing 94 93 67
Product development 108 116 97
General and administrative 139 102 107
Total stock-based compensation expense $379 $344 $298
Capitalized in product development $ 13 $ 12 $ 10
As of December 31, 2015, there was approximately $544 million of unearned stock-based compensation
that will be expensed from 2016 through 2019. If there are any modifications or cancellations of the underlying
unvested awards, we may be required to accelerate, increase or cancel all or a portion of the remaining unearned
stock-based compensation expense. Future unearned stock-based compensation will increase to the extent we
grant additional equity awards, change the mix of grants between stock options and restricted stock units or
assume unvested equity awards in connection with acquisitions.
F-41