eBay 2015 Annual Report Download - page 42
Download and view the complete annual report
Please find page 42 of the 2015 eBay annual report below. You can navigate through the pages in the report by either clicking on the pages listed below, or by using the keyword search tool below to find specific information within the annual report.-
 1
1 -
2
-
3
-
4
-
5
-
6
-
7
-
8
-
9
-
10
-
11
-
12
-
13
-
14
-
15
-
16
-
17
-
18
-
19
-
20
-
21
-
22
-
23
-
24
-
25
-
26
-
27
-
28
-
29
-
30
-
31
-
 32
32 -
 33
33 -
 34
34 -
 35
35 -
 36
36 -
 37
37 -
 38
38 -
 39
39 -
 40
40 -
 41
41 -
 42
42 -
 43
43 -
 44
44 -
 45
45 -
 46
46 -
 47
47 -
 48
48 -
 49
49 -
 50
50 -
 51
51 -
 52
52 -
53
-
54
-
55
-
56
-
57
-
58
-
59
-
60
-
61
-
62
-
63
-
64
-
65
-
66
-
67
-
68
-
69
-
70
-
71
-
72
-
73
-
74
-
75
-
76
-
77
-
78
-
79
-
80
-
81
-
82
-
83
-
84
-
85
-
86
-
87
-
88
-
89
-
90
-
91
-
92
-
93
-
94
-
95
-
96
-
97
-
98
-
99
-
100
-
101
-
102
-
103
-
104
-
105
-
106
-
107
-
108
-
109
-
110
-
111
-
112
-
113
-
114
-
115
-
116
-
117
-
118
-
119
-
120
-
121
-
122
-
123
-
124
-
125
-
126
-
127
-
128
-
129
-
130
-
131
-
132
-
133
-
134
-
135
-
136
 |
 |

PART II
ITEM 5: MARKET FOR REGISTRANT’S COMMON EQUITY, RELATED STOCKHOLDER MATTERS
AND ISSUER PURCHASES OF EQUITY SECURITIES
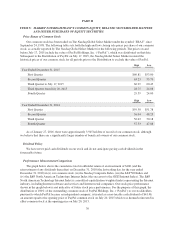
Price Range of Common Stock
Our common stock has been traded on The Nasdaq Global Select Market under the symbol “EBAY” since
September 24, 1998. The following table sets forth the high and low closing sale prices per share of our common
stock, as actually reported by The Nasdaq Global Select Market for the following periods. The prices on and
before July 17, 2015 include the value of PayPal Holdings, Inc. (“PayPal”), which was distributed on that date.
Subsequent to the Distribution of PayPal on July 17, 2015, the Nasdaq Global Select Market restated the
historical prices of our common stock for all periods prior to the Distribution to exclude the value of PayPal.
High Low
Year Ended December 31, 2015
First Quarter $60.81 $53.00
Second Quarter 63.23 55.79
Third Quarter to July 17, 2015 66.29 60.43
Third Quarter from July 20, 2015 28.75 24.08
Fourth Quarter 29.59 24.00
High Low
Year Ended December 31, 2014
First Quarter $59.30 $51.78
Second Quarter 56.04 48.25
Third Quarter 56.63 50.18
Fourth Quarter 57.53 47.88
As of January 27, 2016, there were approximately 3,945 holders of record of our common stock, although
we believe that there are a significantly larger number of beneficial owners of our common stock.
Dividend Policy
We have never paid cash dividends on our stock and do not anticipate paying cash dividends in the
foreseeable future.
Performance Measurement Comparison
The graph below shows the cumulative total stockholder return of an investment of $100 (and the
reinvestment of any dividends thereafter) on December 31, 2010 (the last trading day for the year ended
December 31, 2010) in (i) our common stock, (ii) the Nasdaq Composite Index, (iii) the S&P 500 Index and
(iv) the S&P North American Technology Internet Index (the successor to the GSTI Internet Index). The S&P
North American Technology Internet Index is a modified-capitalization weighted index representing the Internet
industry, including Internet software and services and Internet retail companies. Our stock price performance
shown in the graph below is not indicative of future stock price performance. For the purpose of this graph, the
distribution of 100% of the outstanding common stock of PayPal Holdings, Inc. (“PayPal”) to our stockholders,
pursuant to which PayPal became an independent company, is treated as a non-taxable cash dividend of $41.46,
an amount equal to the opening price of PayPal common stock on July 20, 2015 which was deemed reinvested in
eBay common stock at the opening price on July 20, 2015.
30