eBay 2015 Annual Report Download - page 59
Download and view the complete annual report
Please find page 59 of the 2015 eBay annual report below. You can navigate through the pages in the report by either clicking on the pages listed below, or by using the keyword search tool below to find specific information within the annual report.-
 1
1 -
2
-
3
-
4
-
5
-
6
-
7
-
8
-
9
-
10
-
11
-
12
-
13
-
14
-
15
-
16
-
17
-
18
-
19
-
20
-
21
-
22
-
23
-
24
-
25
-
26
-
27
-
28
-
29
-
30
-
31
-
32
-
33
-
34
-
35
-
36
-
37
-
38
-
39
-
40
-
41
-
42
-
43
-
44
-
45
-
46
-
47
-
48
-
 49
49 -
 50
50 -
 51
51 -
 52
52 -
 53
53 -
 54
54 -
 55
55 -
 56
56 -
 57
57 -
 58
58 -
 59
59 -
 60
60 -
 61
61 -
 62
62 -
 63
63 -
 64
64 -
 65
65 -
 66
66 -
 67
67 -
 68
68 -
 69
69 -
70
-
71
-
72
-
73
-
74
-
75
-
76
-
77
-
78
-
79
-
80
-
81
-
82
-
83
-
84
-
85
-
86
-
87
-
88
-
89
-
90
-
91
-
92
-
93
-
94
-
95
-
96
-
97
-
98
-
99
-
100
-
101
-
102
-
103
-
104
-
105
-
106
-
107
-
108
-
109
-
110
-
111
-
112
-
113
-
114
-
115
-
116
-
117
-
118
-
119
-
120
-
121
-
122
-
123
-
124
-
125
-
126
-
127
-
128
-
129
-
130
-
131
-
132
-
133
-
134
-
135
-
136
 |
 |

During the second quarter of 2015, our Board approved a plan to sell Enterprise. As a result, the Enterprise
financial results were reflected in our consolidated statement of income, retrospectively, as discontinued
operations beginning in the second quarter of 2015. On July 16, 2015, we signed a definitive agreement to sell
Enterprise and on November 2, 2015, the sale closed. As a result, the related assets and liabilities associated with
the discontinued operations in the prior year consolidated balance sheet are classified as discontinued operations.
See “Note 4 — Discontinued Operations” to our consolidated financial statements included in this report.
Non-GAAP Measure of Financial Performance
To supplement our consolidated financial statements presented in accordance with generally accepted
accounting principles, or GAAP, we use FX-Neutral net revenues, which are non-GAAP financial measures. We
define the FX-Neutral net revenue as net revenue minus the exchange rate effect. We define exchange rate effect
as the year-over-year impact of foreign currency movements using prior period foreign currency rates applied to
current year transactional currency amounts.
These non-GAAP measures are not in accordance with, or an alternative to, measures prepared in
accordance with GAAP and may be different from non-GAAP measures used by other companies. In addition,
these non-GAAP measures are not based on any comprehensive set of accounting rules or principles. Non-GAAP
measures have limitations in that they do not reflect all of the amounts associated with our results of operations
as determined in accordance with GAAP. These measures should only be used to evaluate our results of
operations in conjunction with the corresponding GAAP measures.
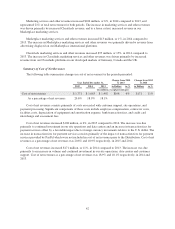
Reconciliation of FX-neutral net revenues to the most directly comparable GAAP measure can be found in
the table under “Impact of Foreign Currency Exchange Rates” included above. These non-GAAP measures are
provided to enhance investors’ overall understanding of our current financial performance and its prospects for
the future. Specifically, we believe these non-GAAP measures provide useful information to both management
and investors by excluding the foreign currency exchange rate impact that may not be indicative of our core
operating results and business outlook. In addition, because we have historically reported certain non-GAAP
results to investors, we believe that the inclusion of these non-GAAP measures provide consistency in our
financial reporting.
In addition to these corresponding GAAP measures, management uses the foregoing non-GAAP measures
in reviewing our financial results.
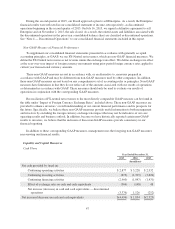
Liquidity and Capital Resources
Cash Flows
Year Ended December 31,
2015 2014 2013
(In millions)
Net cash provided by (used in):
Continuing operating activities $ 2,877 $ 3,228 $ 2,932
Continuing investing activities (673) (1,325) (3,620)
Continuing financing activities (2,960) (1,047) (1,431)
Effect of exchange rates on cash and cash equivalents (364) (148) 48
Net increase (decrease) in cash and cash equivalents — discontinued
operations (3,376) 1,126 (252)
Net increase/(decrease) in cash and cash equivalents $(4,496) $ 1,834 $(2,323)
47