eBay 2015 Annual Report Download - page 57
Download and view the complete annual report
Please find page 57 of the 2015 eBay annual report below. You can navigate through the pages in the report by either clicking on the pages listed below, or by using the keyword search tool below to find specific information within the annual report.-
 1
1 -
2
-
3
-
4
-
5
-
6
-
7
-
8
-
9
-
10
-
11
-
12
-
13
-
14
-
15
-
16
-
17
-
18
-
19
-
20
-
21
-
22
-
23
-
24
-
25
-
26
-
27
-
28
-
29
-
30
-
31
-
32
-
33
-
34
-
35
-
36
-
37
-
38
-
39
-
40
-
41
-
42
-
43
-
44
-
45
-
46
-
 47
47 -
 48
48 -
 49
49 -
 50
50 -
 51
51 -
 52
52 -
 53
53 -
 54
54 -
 55
55 -
 56
56 -
 57
57 -
 58
58 -
 59
59 -
 60
60 -
 61
61 -
 62
62 -
 63
63 -
 64
64 -
 65
65 -
 66
66 -
 67
67 -
68
-
69
-
70
-
71
-
72
-
73
-
74
-
75
-
76
-
77
-
78
-
79
-
80
-
81
-
82
-
83
-
84
-
85
-
86
-
87
-
88
-
89
-
90
-
91
-
92
-
93
-
94
-
95
-
96
-
97
-
98
-
99
-
100
-
101
-
102
-
103
-
104
-
105
-
106
-
107
-
108
-
109
-
110
-
111
-
112
-
113
-
114
-
115
-
116
-
117
-
118
-
119
-
120
-
121
-
122
-
123
-
124
-
125
-
126
-
127
-
128
-
129
-
130
-
131
-
132
-
133
-
134
-
135
-
136
 |
 |

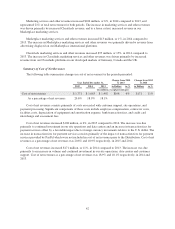
corresponding increase in our amortization expense in periods subsequent to acquisition. We amortize intangible
assets over the period of estimated benefit, using the straight-line method and estimated useful lives ranging from
one to six years. Amortization of acquired intangible assets is also impacted by our sales of assets and businesses
and timing of acquired intangible assets becoming fully amortized. See “Note 5 — Goodwill and Intangible
Assets” to our consolidated financial statements included in this report.
Amortization of acquired intangible assets decreased by $34 million, or 45%, in 2015 compared to 2014.
The decrease was due to certain intangible assets becoming fully amortized during the year.
Amortization of acquired intangible assets decreased by $61 million, or 45%, in 2014 compared to 2013.
The decrease was due to certain intangible assets becoming fully amortized during the year.
Interest and Other, Net
Interest and other, net consists primarily of interest earned on cash, cash equivalents and investments, as
well as foreign exchange transaction gains and losses, our portion of operating results from investments
accounted for under the equity method of accounting, investment gain/loss on acquisitions or disposals and
interest expense, consisting of interest charges on any amounts borrowed and commitment fees on unborrowed
amounts under our credit agreement and interest expense on our outstanding debt securities and commercial
paper, if any.
Interest and other, net, increased $170 million in 2015 compared to 2014. The increase in interest and other,
net was due primarily to gains on sale of investments partially offset by an increase in interest expense due to the
issuance of debt securities in July 2014 and a decrease in interest income due to a lower overall cash, short-term
investments and long-term investments balances after the Distribution.
Interest and other, net, decreased $78 million in 2014 compared to 2013. The decrease in interest and other,
net was due primarily to a gain on the sale of certain investments in September 2013.
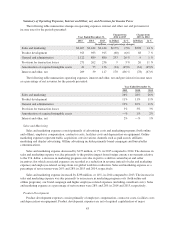
Provision for Income Taxes
Year Ended December 31,
2015 2014 2013
(In millions)
Provision for income taxes $ 459 $3,380 $ 504
Effective tax rate 19% 134% 20%
Our effective tax rate was 19% in 2015 compared to 134% in 2014. The decrease in our effective tax rate
during 2015 compared to 2014 was due primarily to the recognition in 2014 of deferred tax liabilities of
approximately $3.0 billion of U.S. income and applicable foreign withholding taxes on $9.0 billion of
undistributed foreign earnings of certain of our foreign subsidiaries for 2013 and prior years. This was partially
offset by the tax effect of gains on sale of certain investments in 2015.
Our effective tax rate was 134% in 2014 compared to 20% in 2013. The increase in our effective tax rate
during 2014 compared to 2013 was due primarily to the recognition of deferred tax liabilities related to
undistributed foreign earnings of certain of our non-U.S. subsidiaries for 2013 and prior years discussed above,
partially offset by the release of the valuation allowance on our capital loss carryover.
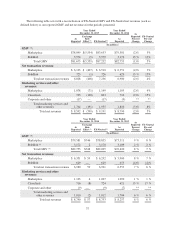
Our relative pretax earnings and revenues attributable to the U.S. as compared to the rest of the world may
differ over time. For the year ended December 31, 2015, our U.S. share of pretax income and net revenues was
16.5% and 42.2%, respectively. For the year ended December 31, 2014, our U.S. share of pretax income and net
revenues was 20.3% and 40.1%, respectively. The difference in relative pretax income and net revenues
attributable to the U.S., as compared to the rest of the world for both 2015 and 2014, was primarily related to
45