eBay 2015 Annual Report Download - page 60
Download and view the complete annual report
Please find page 60 of the 2015 eBay annual report below. You can navigate through the pages in the report by either clicking on the pages listed below, or by using the keyword search tool below to find specific information within the annual report.-
 1
1 -
2
-
3
-
4
-
5
-
6
-
7
-
8
-
9
-
10
-
11
-
12
-
13
-
14
-
15
-
16
-
17
-
18
-
19
-
20
-
21
-
22
-
23
-
24
-
25
-
26
-
27
-
28
-
29
-
30
-
31
-
32
-
33
-
34
-
35
-
36
-
37
-
38
-
39
-
40
-
41
-
42
-
43
-
44
-
45
-
46
-
47
-
48
-
49
-
 50
50 -
 51
51 -
 52
52 -
 53
53 -
 54
54 -
 55
55 -
 56
56 -
 57
57 -
 58
58 -
 59
59 -
 60
60 -
 61
61 -
 62
62 -
 63
63 -
 64
64 -
 65
65 -
 66
66 -
 67
67 -
 68
68 -
 69
69 -
 70
70 -
71
-
72
-
73
-
74
-
75
-
76
-
77
-
78
-
79
-
80
-
81
-
82
-
83
-
84
-
85
-
86
-
87
-
88
-
89
-
90
-
91
-
92
-
93
-
94
-
95
-
96
-
97
-
98
-
99
-
100
-
101
-
102
-
103
-
104
-
105
-
106
-
107
-
108
-
109
-
110
-
111
-
112
-
113
-
114
-
115
-
116
-
117
-
118
-
119
-
120
-
121
-
122
-
123
-
124
-
125
-
126
-
127
-
128
-
129
-
130
-
131
-
132
-
133
-
134
-
135
-
136
 |
 |
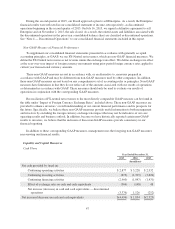
Continuing Operating Activities
The net cash provided by continuing operating activities of $2.9 billion in 2015 was due primarily to net
income of $1.7 billion with adjustments for loss from discontinued operations of $222 million, $687 million in
depreciation and amortization, $379 million in stock-based compensation and $271 million in provision for
transaction losses and a decrease of $195 million related to gain on sale of investments and $106 million in
changes in assets and liabilities, net of acquisition effects.
The net cash provided by continuing operating activities of $3.2 billion in 2014 was due primarily to net
income of $46 million with adjustments for income from discontinued operations of $911 million, $682 million
in depreciation and amortization, $344 million in stock-based compensation, $262 million in provision for
transaction losses, $2.7 billion in deferred income taxes and $148 million in changes in assets and liabilities, net
of acquisition effects.
The net cash provided by continuing operating activities of $2.9 billion in 2013 was due primarily to net
income of $2.9 billion with adjustments for income from discontinued operations of $789 million, $660 million
in depreciation and amortization, $298 million in stock-based compensation expense and $236 million in
provision for transaction and loan losses and a decrease of $109 million in changes in assets and liabilities.
Cash paid for income taxes in 2015, 2014 and 2013 was $256 million, $343 million and $466 million,
respectively.
Continuing Investing Activities
The net cash used in continuing investing activities of $673 million in 2015 was due primarily to cash paid
for purchases of investments of $6.7 billion, purchases of property and equipment of $668 million and net cash
paid for acquisition of businesses of $24 million, partially offset by proceeds of $6.8 billion from the maturities
and sales of investments.
The net cash used in continuing investing activities of $1.3 billion in 2014 was due primarily to cash paid
for purchases of investments of $8.8 billion, purchases of property and equipment of $622 million and net cash
paid for acquisition of businesses of $55 million partially offset by proceeds of $8.1 billion from the maturities
and sales of investments.
The net cash used in continuing investing activities of $3.6 billion in 2013 was due primarily to net cash
paid for purchases of investments of $6.9 billion, purchases of property and equipment of $678 million and net
cash paid for acquisition of businesses of $138 million partially offset by proceeds of $3.6 billion from the
maturities and sales of investments and $485 million from the repayment of note receivable and sale of related
equity investments.
The largely offsetting effects of purchases of investments and maturities and sale of investments results
from the management of our portfolio of short term and long term investments. As our immediate cash needs
change, purchase and sale activity will fluctuate. In the year ended December 31, 2014, a portion of the proceeds
from the issuance of senior notes were used to purchase investments in our short term and long term portfolios.
Continuing Financing Activities
The net cash used in continuing financing activities of $3.0 billion in 2015 was due primarily to cash
outflows from $2.1 billion to repurchase common stock, $850 million payment of debt upon maturity and cash
paid for tax withholdings in the amount of $245 million related to net share settlements of restricted stock units
and awards. These cash outflows were partially offset by cash inflows of $221 million from the issuance of
common stock in connection with the exercise of stock options and the effect of $74 million of excess tax
benefits from stock-based compensation.
48