eBay 2015 Annual Report Download - page 43
Download and view the complete annual report
Please find page 43 of the 2015 eBay annual report below. You can navigate through the pages in the report by either clicking on the pages listed below, or by using the keyword search tool below to find specific information within the annual report.-
 1
1 -
2
-
3
-
4
-
5
-
6
-
7
-
8
-
9
-
10
-
11
-
12
-
13
-
14
-
15
-
16
-
17
-
18
-
19
-
20
-
21
-
22
-
23
-
24
-
25
-
26
-
27
-
28
-
29
-
30
-
31
-
32
-
 33
33 -
 34
34 -
 35
35 -
 36
36 -
 37
37 -
 38
38 -
 39
39 -
 40
40 -
 41
41 -
 42
42 -
 43
43 -
 44
44 -
 45
45 -
 46
46 -
 47
47 -
 48
48 -
 49
49 -
 50
50 -
 51
51 -
 52
52 -
 53
53 -
54
-
55
-
56
-
57
-
58
-
59
-
60
-
61
-
62
-
63
-
64
-
65
-
66
-
67
-
68
-
69
-
70
-
71
-
72
-
73
-
74
-
75
-
76
-
77
-
78
-
79
-
80
-
81
-
82
-
83
-
84
-
85
-
86
-
87
-
88
-
89
-
90
-
91
-
92
-
93
-
94
-
95
-
96
-
97
-
98
-
99
-
100
-
101
-
102
-
103
-
104
-
105
-
106
-
107
-
108
-
109
-
110
-
111
-
112
-
113
-
114
-
115
-
116
-
117
-
118
-
119
-
120
-
121
-
122
-
123
-
124
-
125
-
126
-
127
-
128
-
129
-
130
-
131
-
132
-
133
-
134
-
135
-
136
 |
 |

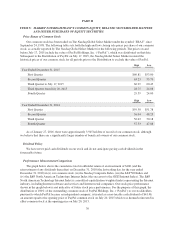
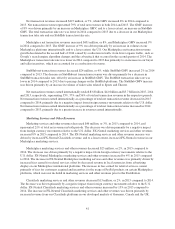
The following graph and related information shall not be deemed “soliciting material” or be deemed to be
“filed” with the SEC, nor shall such information be incorporated by reference into any past or future filing with
the SEC, except to the extent that such filing specifically states that such graph and related information are
incorporated by reference into such filing.
12/31/10
U.S. Dollar
12/31/11 12/31/12 12/31/13 12/31/14 12/31/15
$0
$100
$200
$300
eBay S&P North America Technology Internet Index
NASDAQ Composite Index S&P 500 Index
Stock repurchase activity during the three months ended December 31, 2015 was as follows:
Period Ended
Total Number of
Shares Purchased
Average Price Paid per
Share
Total Number of
Shares Purchased as
Part of Publicly
Announced Programs
Maximum Dollar Value
of Shares that May Yet
be Purchased Under
the Programs (1)
October 31, 2015 8,061,823 $26.05 8,061,823 $2,175,693,213
November 30, 2015 10,051,252 $28.85 10,051,252 $1,885,732,534
December 31, 2015 1,784,886 $27.73 1,784,886 $1,836,232,723
19,897,961 19,897,961
(1) In January 2014, our Board authorized a stock repurchase program that provided for the repurchase of up to
an additional $5 billion of our common stock, with no expiration from the date of authorization. In January
2015, our Board authorized an additional $2 billion stock repurchase program, with no expiration from the
date of authorization. In June 2015, our Board authorized an additional $1 billion stock repurchase program,
with no expiration from the date of authorization. The stock repurchase programs are intended to
programmatically offset the impact of dilution from our equity compensation programs and, in addition,
subject to market conditions and other factors, to make opportunistic repurchases of our common stock to
reduce outstanding share count. Any share repurchases under our stock repurchase programs may be made
through open market transactions, block trades, privately negotiated transactions (including accelerated
share repurchase transactions) or other means at times and in such amounts as management deems
appropriate and will be funded from our working capital or other financing alternatives.
31