eBay 2015 Annual Report Download - page 52
Download and view the complete annual report
Please find page 52 of the 2015 eBay annual report below. You can navigate through the pages in the report by either clicking on the pages listed below, or by using the keyword search tool below to find specific information within the annual report.-
 1
1 -
2
-
3
-
4
-
5
-
6
-
7
-
8
-
9
-
10
-
11
-
12
-
13
-
14
-
15
-
16
-
17
-
18
-
19
-
20
-
21
-
22
-
23
-
24
-
25
-
26
-
27
-
28
-
29
-
30
-
31
-
32
-
33
-
34
-
35
-
36
-
37
-
38
-
39
-
40
-
41
-
 42
42 -
 43
43 -
 44
44 -
 45
45 -
 46
46 -
 47
47 -
 48
48 -
 49
49 -
 50
50 -
 51
51 -
 52
52 -
 53
53 -
 54
54 -
 55
55 -
 56
56 -
 57
57 -
 58
58 -
 59
59 -
 60
60 -
 61
61 -
 62
62 -
63
-
64
-
65
-
66
-
67
-
68
-
69
-
70
-
71
-
72
-
73
-
74
-
75
-
76
-
77
-
78
-
79
-
80
-
81
-
82
-
83
-
84
-
85
-
86
-
87
-
88
-
89
-
90
-
91
-
92
-
93
-
94
-
95
-
96
-
97
-
98
-
99
-
100
-
101
-
102
-
103
-
104
-
105
-
106
-
107
-
108
-
109
-
110
-
111
-
112
-
113
-
114
-
115
-
116
-
117
-
118
-
119
-
120
-
121
-
122
-
123
-
124
-
125
-
126
-
127
-
128
-
129
-
130
-
131
-
132
-
133
-
134
-
135
-
136
 |
 |

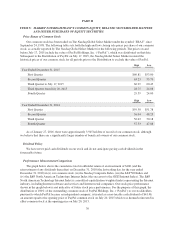
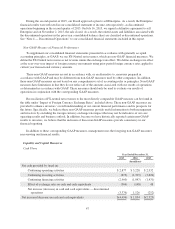
(3) We define total transaction take rate as total net transaction revenues divided by GMV.
(4) During the first quarter of 2014, we revised our definition of GMV for certain transactions to align more
closely with our operating metrics. 2013 amounts have been revised to conform to the current period
reporting definition.
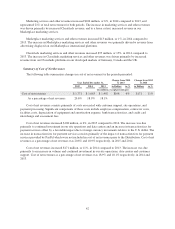
Seasonality
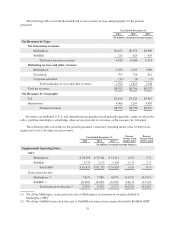
The following table sets forth, for the periods presented, our total net revenues and the sequential quarterly
movements of these net revenues:
Quarter Ended
March 31 June 30 September 30 December 31
(In millions, except percentage changes)
2014
Net revenues $ 2,149 $2,168 $2,150 $2,323
Percent change from prior quarter (6)% 1% (1)% 8%
2015
Net revenues $ 2,061 $2,110 $2,099 $2,322
Percent change from prior quarter (11)% 2% (1)% 11%
We expect transaction activity patterns on our platforms to mirror general consumer buying patterns. We
expect that these trends will continue.
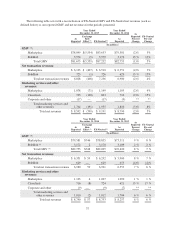
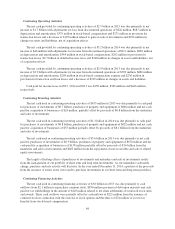
Net Transaction Revenues
Net transaction revenues decreased $152 million, or 2%, while GMV decreased 1%, in 2015 compared to
2014. Net transaction revenue represented 79% of total net revenues in both 2015 in 2014. The decrease in net
transaction revenues and GMV was driven primarily by a negative impact from foreign currency movements
relative to the U.S. dollar. FX-Neutral net transaction revenue and FX-Neutral GMV increased 4% and 5%
respectively, in 2015 compared to 2014. The FX-Neutral GMV increase of 5% was driven by an increase in
FX-Neutral Marketplace GMV, and to a lesser extent, StubHub GMV. The total transaction take rate was lower
in 2015 compared to 2014 due to decrease in our Marketplace transaction take rate, partially offset by an increase
in our StubHub transaction take rate.
Marketplace net transaction revenues decreased $248 million, or 4%, while Marketplace GMV decreased
2%, in 2015 compared to 2014. The decrease in Marketplace net transaction revenues and Marketplace GMV
was driven primarily by a negative impact from foreign currency movements relative to the U.S. dollar.
FX-Neutral Marketplace net transaction revenue and FX-Neutral Marketplace GMV increased 3% and 5%
respectively, in 2015 compared to 2014. The FX-Neutral Marketplace GMV increase of 5% was driven primarily
by an increase in volume in local currencies on our Marketplace platforms internationally and to a lesser extent,
the U.S. The increase in FX-Neutral Marketplace net transaction revenue was less than the increase in
FX-Neutral Marketplace GMV due to a lower Marketplace transaction take rate. The Marketplace transaction
take rate was lower in 2015 compared to 2014 due to a shift in geographical and vertical mix, as well as an
increase in our buyer and seller incentives, which are accounted for as a reduction of revenue.
StubHub net transaction revenues increased $96 million, or 15%, while StubHub GMV increased 13% in
2015 compared to 2014. The increase in StubHub net transaction revenues was driven primarily by an increase in
StubHub GMV and an increase in StubHub transaction take rate. The StubHub GMV increase was driven
primarily by an increase in volume of ticket sales related to Sports and Concerts. The increase in StubHub net
transaction revenue was greater than the increase in StubHub GMV due to a higher StubHub transaction take
rate. The StubHub transaction take rate was higher in 2015 compared to 2014 due primarily to a change in mix of
events and sellers on the StubHub platforms.
40