eBay 2015 Annual Report Download - page 123
Download and view the complete annual report
Please find page 123 of the 2015 eBay annual report below. You can navigate through the pages in the report by either clicking on the pages listed below, or by using the keyword search tool below to find specific information within the annual report.-
 1
1 -
2
-
3
-
4
-
5
-
6
-
7
-
8
-
9
-
10
-
11
-
12
-
13
-
14
-
15
-
16
-
17
-
18
-
19
-
20
-
21
-
22
-
23
-
24
-
25
-
26
-
27
-
28
-
29
-
30
-
31
-
32
-
33
-
34
-
35
-
36
-
37
-
38
-
39
-
40
-
41
-
42
-
43
-
44
-
45
-
46
-
47
-
48
-
49
-
50
-
51
-
52
-
53
-
54
-
55
-
56
-
57
-
58
-
59
-
60
-
61
-
62
-
63
-
64
-
65
-
66
-
67
-
68
-
69
-
70
-
71
-
72
-
73
-
74
-
75
-
76
-
77
-
78
-
79
-
80
-
81
-
82
-
83
-
84
-
85
-
86
-
87
-
88
-
89
-
90
-
91
-
92
-
93
-
94
-
95
-
96
-
97
-
98
-
99
-
100
-
101
-
102
-
103
-
104
-
105
-
106
-
107
-
108
-
109
-
110
-
111
-
112
-
 113
113 -
 114
114 -
 115
115 -
 116
116 -
 117
117 -
 118
118 -
 119
119 -
 120
120 -
 121
121 -
 122
122 -
 123
123 -
 124
124 -
 125
125 -
 126
126 -
 127
127 -
 128
128 -
 129
129 -
 130
130 -
 131
131 -
 132
132 -
 133
133 -
134
-
135
-
136
 |
 |

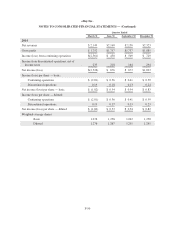
eBay Inc.
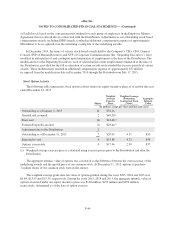
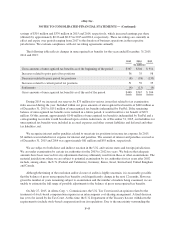
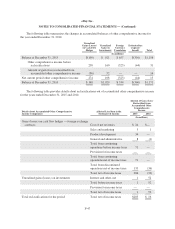
NOTES TO CONSOLIDATED FINANCIAL STATEMENTS — (Continued)
Supplementary Data — Quarterly Financial Data — Unaudited
The following tables present certain unaudited consolidated quarterly financial information for each of the
eight quarters ended December 31, 2015. This quarterly information has been prepared on the same basis as the
Consolidated Financial Statements and includes all adjustments necessary to state fairly the information for the
periods presented.
Quarterly Financial Data
(Unaudited, in millions, except per share amounts)
Quarter Ended
March 31 June 30 September 30 December 31
2015
Net revenues $2,061 $2,110 $2,099 $2,322
Gross profit $1,650 $1,676 $1,666 $1,829
Income from continuing operations $ 449 $ 430 $ 545 $ 523
Income (loss) from discontinued operations, net
of income taxes 177 (347) (6) (46)
Net income $ 626 $ 83 $ 539 $ 477
Income (loss) per share — basic:
Continuing operations $ 0.37 $ 0.35 $ 0.45 $ 0.44
Discontinued operations 0.14 (0.28) — (0.04)
Net income per share — basic $ 0.51 $ 0.07 $ 0.45 $ 0.40
Income (loss) per share — diluted:
Continuing operations $ 0.37 $ 0.35 $ 0.45 $ 0.43
Discontinued operations 0.14 (0.28) — (0.04)
Net income per share — diluted $ 0.51 $ 0.07 $ 0.45 $ 0.39
Weighted-average shares:
Basic 1,216 1,217 1,210 1,191
Diluted 1,229 1,225 1,223 1,204
F-49