eBay 2015 Annual Report Download - page 51
Download and view the complete annual report
Please find page 51 of the 2015 eBay annual report below. You can navigate through the pages in the report by either clicking on the pages listed below, or by using the keyword search tool below to find specific information within the annual report.-
 1
1 -
2
-
3
-
4
-
5
-
6
-
7
-
8
-
9
-
10
-
11
-
12
-
13
-
14
-
15
-
16
-
17
-
18
-
19
-
20
-
21
-
22
-
23
-
24
-
25
-
26
-
27
-
28
-
29
-
30
-
31
-
32
-
33
-
34
-
35
-
36
-
37
-
38
-
39
-
40
-
 41
41 -
 42
42 -
 43
43 -
 44
44 -
 45
45 -
 46
46 -
 47
47 -
 48
48 -
 49
49 -
 50
50 -
 51
51 -
 52
52 -
 53
53 -
 54
54 -
 55
55 -
 56
56 -
 57
57 -
 58
58 -
 59
59 -
 60
60 -
 61
61 -
62
-
63
-
64
-
65
-
66
-
67
-
68
-
69
-
70
-
71
-
72
-
73
-
74
-
75
-
76
-
77
-
78
-
79
-
80
-
81
-
82
-
83
-
84
-
85
-
86
-
87
-
88
-
89
-
90
-
91
-
92
-
93
-
94
-
95
-
96
-
97
-
98
-
99
-
100
-
101
-
102
-
103
-
104
-
105
-
106
-
107
-
108
-
109
-
110
-
111
-
112
-
113
-
114
-
115
-
116
-
117
-
118
-
119
-
120
-
121
-
122
-
123
-
124
-
125
-
126
-
127
-
128
-
129
-
130
-
131
-
132
-
133
-
134
-
135
-
136
 |
 |

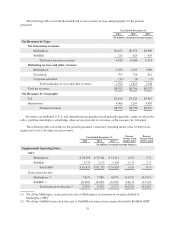
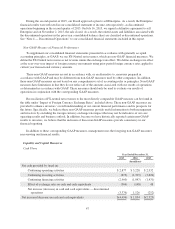
The following table sets forth the breakdown of net revenues by type and geography for the periods
presented.
Year Ended December 31,
2015 2014 2013
(In millions, except percentage changes)
Net Revenues by Type:
Net transaction revenues:
Marketplace $6,103 $6,351 $5,900
StubHub 725 629 653
Total net transaction revenues 6,828 6,980 6,553
Marketing services and other revenues:
Marketplace 1,078 1,103 1,090
Classifieds 703 716 621
Corporate and other (17) (9) (7)
Total marketing services and other revenues 1,764 1,810 1,704
Total net revenues $8,592 $8,790 $8,257
Net Revenues by Geography:
U.S. $3,624 $3,525 $3,419
International 4,968 5,265 4,838
Total net revenues $8,592 $8,790 $8,257
Revenues are attributed to U.S. and international geographies based primarily upon the country in which the
seller, platform that displays advertising, other service provider or customer, as the case may be, is located.
The following table sets forth, for the periods presented, certain key operating metrics that we believe are
significant factors affecting our net revenues.
Year Ended December 31, Percent
Change from
2014 to 2015
Percent
Change from
2013 to 20142015 2014 2013 (4)
(In millions, except percentage changes)
Supplemental Operating Data:
GMV:
Marketplace $ 78,099 $ 79,581 $ 73,311 (2)% 9 %
StubHub 3,574 3,172 3,109 13 % 2 %
Total GMV $ 81,673 $ 82,753 $ 76,420 (1)% 8 %
Transaction take rate:
Marketplace (1) 7.81% 7.98% 8.05% (0.17)% (0.07)%
StubHub (2) 20.29% 19.83% 21.00% 0.46 % (1.17)%
Total transaction take rate (3) 8.36% 8.43% 8.57% (0.07)% (0.14)%
(1) We define Marketplace transaction take rate as Marketplace net transaction revenues divided by
Marketplace GMV.
(2) We define StubHub transaction take rate as StubHub net transaction revenues divided by StubHub GMV.
39