eBay 2015 Annual Report Download - page 54
Download and view the complete annual report
Please find page 54 of the 2015 eBay annual report below. You can navigate through the pages in the report by either clicking on the pages listed below, or by using the keyword search tool below to find specific information within the annual report.-
 1
1 -
2
-
3
-
4
-
5
-
6
-
7
-
8
-
9
-
10
-
11
-
12
-
13
-
14
-
15
-
16
-
17
-
18
-
19
-
20
-
21
-
22
-
23
-
24
-
25
-
26
-
27
-
28
-
29
-
30
-
31
-
32
-
33
-
34
-
35
-
36
-
37
-
38
-
39
-
40
-
41
-
42
-
43
-
 44
44 -
 45
45 -
 46
46 -
 47
47 -
 48
48 -
 49
49 -
 50
50 -
 51
51 -
 52
52 -
 53
53 -
 54
54 -
 55
55 -
 56
56 -
 57
57 -
 58
58 -
 59
59 -
 60
60 -
 61
61 -
 62
62 -
 63
63 -
 64
64 -
65
-
66
-
67
-
68
-
69
-
70
-
71
-
72
-
73
-
74
-
75
-
76
-
77
-
78
-
79
-
80
-
81
-
82
-
83
-
84
-
85
-
86
-
87
-
88
-
89
-
90
-
91
-
92
-
93
-
94
-
95
-
96
-
97
-
98
-
99
-
100
-
101
-
102
-
103
-
104
-
105
-
106
-
107
-
108
-
109
-
110
-
111
-
112
-
113
-
114
-
115
-
116
-
117
-
118
-
119
-
120
-
121
-
122
-
123
-
124
-
125
-
126
-
127
-
128
-
129
-
130
-
131
-
132
-
133
-
134
-
135
-
136
 |
 |

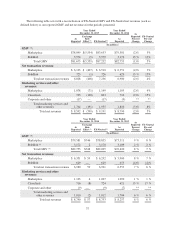
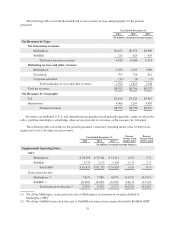
Marketing services and other revenues increased $106 million, or 6%, in 2014 compared to 2013, and
represented 21% of total net revenues for both periods. The increase in marketing services and other revenues
was driven primarily by increased Classifieds revenue, and to a lesser extent, increased revenue in our
Marketplace marketing services.
Marketplace marketing services and other revenues increased $13 million, or 1%, in 2014 compared to
2013. The increase in Marketplace marketing services and other revenues was primarily driven by revenue from
advertising displayed on our Marketplace international platforms.
Classifieds marketing services and other revenues increased $95 million, or 15%, in 2014 compared to
2013. The increase in Classifieds marketing services and other revenues was driven primarily by increased
revenue from our Classifieds platforms in our developed markets of Germany, Canada and the UK.
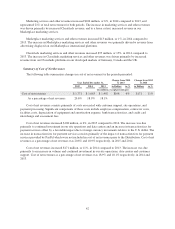
Summary of Cost of Net Revenues
The following table summarizes changes in cost of net revenues for the periods presented:
Year Ended December 31,
Change from 2014
to 2015
Change from 2013
to 2014
2015 2014 2013 in Dollars in % in Dollars in %
(In millions, except percentages)
Cost of net revenues $ 1,771 $ 1,663 $ 1,492 $108 6% $171 11%
As a percentage of net revenues 20.6% 18.9% 18.1%
Cost of net revenues consists primarily of costs associated with customer support, site operations, and
payment processing. Significant components of these costs include employee compensation, contractor costs,
facilities costs, depreciation of equipment and amortization expense, bank transaction fees, and credit card
interchange and assessment fees.
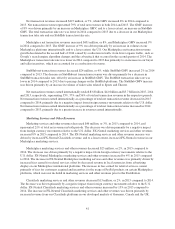
Cost of net revenues increased $108 million, or 6%, in 2015 compared to 2014. The increase was due
primarily to continued investment in our site operations and data centers and an increase in transaction fees for
payment services offset by a favorable impact due to foreign currency movements relative to the U.S. dollar. The
increase in transaction fees for payment services consists primarily of the impact of transaction fees for payment
services provided by PayPal which were not included in cost of net revenues prior to the Distribution. Cost of net
revenues as a percentage of net revenues was 20.6% and 18.9% respectively, in 2015 and 2014.
Cost of net revenues increased $171 million, or 11%, in 2014 compared to 2013. The increase was due
primarily to an increase in volume and continued investment in our site operations, data centers and customer
support. Cost of net revenues as a percentage of net revenues was 18.9% and 18.1% respectively, in 2014 and
2013.
42