eBay 2015 Annual Report Download - page 56
Download and view the complete annual report
Please find page 56 of the 2015 eBay annual report below. You can navigate through the pages in the report by either clicking on the pages listed below, or by using the keyword search tool below to find specific information within the annual report.-
 1
1 -
2
-
3
-
4
-
5
-
6
-
7
-
8
-
9
-
10
-
11
-
12
-
13
-
14
-
15
-
16
-
17
-
18
-
19
-
20
-
21
-
22
-
23
-
24
-
25
-
26
-
27
-
28
-
29
-
30
-
31
-
32
-
33
-
34
-
35
-
36
-
37
-
38
-
39
-
40
-
41
-
42
-
43
-
44
-
45
-
 46
46 -
 47
47 -
 48
48 -
 49
49 -
 50
50 -
 51
51 -
 52
52 -
 53
53 -
 54
54 -
 55
55 -
 56
56 -
 57
57 -
 58
58 -
 59
59 -
 60
60 -
 61
61 -
 62
62 -
 63
63 -
 64
64 -
 65
65 -
 66
66 -
67
-
68
-
69
-
70
-
71
-
72
-
73
-
74
-
75
-
76
-
77
-
78
-
79
-
80
-
81
-
82
-
83
-
84
-
85
-
86
-
87
-
88
-
89
-
90
-
91
-
92
-
93
-
94
-
95
-
96
-
97
-
98
-
99
-
100
-
101
-
102
-
103
-
104
-
105
-
106
-
107
-
108
-
109
-
110
-
111
-
112
-
113
-
114
-
115
-
116
-
117
-
118
-
119
-
120
-
121
-
122
-
123
-
124
-
125
-
126
-
127
-
128
-
129
-
130
-
131
-
132
-
133
-
134
-
135
-
136
 |
 |
platforms and other product development efforts, including the development of our platform architecture,
migration of certain platforms, and seller tools. Our top technology priorities include structured data, multi-
screen capabilities, improved seller tools and buyer experiences.
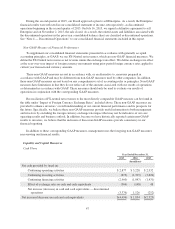
Capitalized internal use and platform development costs were $136 million and $144 million in 2015 and
2014, respectively, and are primarily reflected as a cost of net revenues when amortized in future periods.
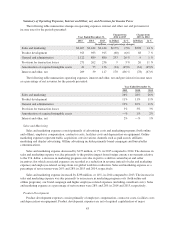
Product development expenses decreased by $60 million, or 6%, in 2015 compared to 2014. The decrease
was due primarily to the positive impact from foreign currency movements and hedging relative to the U.S.
dollar. Product development expenses as a net percentage of revenues were 11% in both 2015 and 2014.
Product development expenses increased by $68 million, or 7%, in 2014 compared to 2013. The increase
was due primarily to higher employee-related costs (including consultant costs) driven by increased investment
in platforms and mobile. Product development expenses as a net percentage of revenues were 11% in both 2014
and 2013.
General and Administrative
General and administrative expenses consist primarily of employee compensation, contractor costs, facilities
costs, depreciation of equipment, employer payroll taxes on stock-based compensation, legal expenses,
restructuring, insurance premiums and professional fees. Our legal expenses, including those related to various
ongoing legal proceedings, may fluctuate substantially from period to period.
General and administrative expenses increased $233 million, or 26%, in 2015 compared to 2014. The
increase was due primarily to restructuring costs related to our global workforce reduction, costs related to the
Distribution (as discussed in Overview above), expenses related to craigslist, Inc. litigation proceedings and an
increase in corporate costs due to a reduction in synergies that existed prior to the Distribution. General and
administrative expenses as a percentage of net revenues were 13% in 2015 and 10% in 2014.
General and administrative expenses increased $9 million, or 1%, in 2014 compared to 2013. The increase
was due primarily to higher employee-related costs. General and administrative expenses as a percentage of net
revenues were 10% in 2014 and 11% in 2013.
Provision for Transaction Losses
Provision for transaction losses consists primarily of transaction loss expense associated with our customer
protection programs, fraud and bad debt expense associated with our accounts receivable balance. We expect our
provision for transaction losses to fluctuate depending on many factors, including changes to our customer
protection programs and the impact of regulatory changes.
Provision for transaction losses increased by $9 million, or 3%, in 2015 compared to 2014. This increase
was driven primarily by higher customer protection program costs, partially offset by a decrease in bad debt
expense. Provision for transaction loss expense as a percentage of net revenues was 3% in both 2015 and 2014.
Provision for transaction losses increased by $26 million, or 11%, in 2014 compared to 2013. This increase
was driven primarily by an increase in transaction volume, partially offset by improvements in our fraud
detection models. Provision for transaction loss expense as a percentage of net revenues was 3% in both 2014
and 2013, respectively.
Amortization of Acquired Intangible Assets
From time to time we have purchased, and we expect to continue to purchase, assets and businesses. These
purchase transactions generally result in the creation of acquired intangible assets with finite lives and lead to a
44