Logitech 2015 Annual Report Download - page 121
Download and view the complete annual report
Please find page 121 of the 2015 Logitech annual report below. You can navigate through the pages in the report by either clicking on the pages listed below, or by using the keyword search tool below to find specific information within the annual report.-
 1
1 -
2
-
3
-
4
-
5
-
6
-
7
-
8
-
9
-
10
-
11
-
12
-
13
-
14
-
15
-
16
-
17
-
18
-
19
-
20
-
21
-
22
-
23
-
24
-
25
-
26
-
27
-
28
-
29
-
30
-
31
-
32
-
33
-
34
-
35
-
36
-
37
-
38
-
39
-
40
-
41
-
42
-
43
-
44
-
45
-
46
-
47
-
48
-
49
-
50
-
51
-
52
-
53
-
54
-
55
-
56
-
57
-
58
-
59
-
60
-
61
-
62
-
63
-
64
-
65
-
66
-
67
-
68
-
69
-
70
-
71
-
72
-
73
-
74
-
75
-
76
-
77
-
78
-
79
-
80
-
81
-
82
-
83
-
84
-
85
-
86
-
87
-
88
-
89
-
90
-
91
-
92
-
93
-
94
-
95
-
96
-
97
-
98
-
99
-
100
-
101
-
102
-
103
-
104
-
105
-
106
-
107
-
108
-
109
-
110
-
 111
111 -
 112
112 -
 113
113 -
 114
114 -
 115
115 -
 116
116 -
 117
117 -
 118
118 -
 119
119 -
 120
120 -
 121
121 -
 122
122 -
 123
123 -
 124
124 -
 125
125 -
 126
126 -
 127
127 -
 128
128 -
 129
129 -
 130
130 -
 131
131 -
132
-
133
-
134
-
135
-
136
-
137
-
138
-
139
-
140
-
141
-
142
-
143
-
144
-
145
-
146
-
147
-
148
-
149
-
150
-
151
-
152
-
153
-
154
-
155
-
156
-
157
-
158
-
159
-
160
-
161
-
162
-
163
-
164
-
165
-
166
-
167
-
168
-
169
-
170
-
171
-
172
-
173
-
174
-
175
-
176
-
177
-
178
-
179
-
180
-
181
-
182
-
183
-
184
-
185
-
186
-
187
-
188
-
189
-
190
-
191
-
192
-
193
-
194
-
195
-
196
-
197
-
198
-
199
-
200
-
201
-
202
-
203
-
204
-
205
-
206
-
207
-
208
-
209
-
210
-
211
-
212
-
213
-
214
-
215
-
216
-
217
-
218
-
219
-
220
-
221
-
222
-
223
-
224
-
225
-
226
-
227
-
228
-
229
-
230
-
231
-
232
-
233
-
234
-
235
-
236
-
237
-
238
-
239
-
240
-
241
-
242
-
243
-
244
-
245
-
246
-
247
-
248
-
249
-
250
-
251
-
252
 |
 |

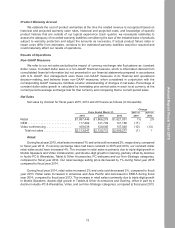
OEM sales and units sold during fiscal year 2015 decreased 17% and 25%, respectively, compared
to fiscal year 2014.
Sales of Lifesize video conferencing products, which were 5% of total net sales during fiscal year
2015, decreased 10% during fiscal year 2015, compared to fiscal year 2014. Lifesize is in the early
stages of transitioning its product portfolio to the recently announced Lifesize Cloud, a software-as-
a-service (SaaS) offering. While sales of the Cloud offering are growing rapidly, they are not yet large
enough to offset the combination of the short-term portfolio transition and soft market conditions for video
conferencing infrastructure.
Our gross margin for fiscal year 2015 increased to 36.6%, compared to 34.2% for fiscal year 2014.
The increase in gross margin primarily reflects the combination of a significant improvement in both our
Profit Maximization categories and Mobile Speakers category, driven largely by product cost reductions
and economies of scale, as well as the benefit from exiting the products included in the Non-Strategic
category.
Operating expenses for fiscal year 2015 were 35.9% of net sales, compared to 30.6% for fiscal
year 2014. The increase in total operating expenses as a percentage of net sales was primarily due to
a goodwill impairment charge of $122.7 million relating to our video conferencing reporting unit, $23.7
million in expenses related to the Audit Committee’s Independent investigation (as described in our
Annual Report on Form 10-K for fiscal year 2014) and related expenses, partially offset by a restructuring
credit of $4.9 million during fiscal year 2015 resulting from partial lease termination of our Silicon Valley
campus, which was previously vacated and under a restructuring plan during fiscal year 2014, as opposed
to a restructuring charge of $13.8 million during fiscal year 2014, as well as savings from prior year’s
restructuring actions and the ongoing rationalization of infrastructure.
Net income for fiscal year 2015 was $9.3 million, compared to net income of $74.3 million for fiscal
year 2014. The decline was primarily due to a goodwill impairment charge of $122.7 million during fiscal
year 2015 partially offset by improvements in gross margin as discussed above.
Given our global sales presence and the reporting of our financial results in U.S. Dollars, our financial
results for fiscal year 2015 were affected by significant shifts in currency exchange rates during fiscal
year 2015. See “Results of Operations” beginning on page 13 for information on the effect of currency
exchange results on our net sales. If the U.S. Dollar remains at its current strong levels in comparison to
other currencies, this will affect our results of operations in future periods as well.
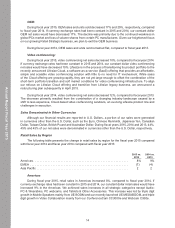
Trends in Our Business
Our sales of PC peripherals for use by consumers in Americas and Europe have historically made
up the large majority of our revenues. In the last several years, the PC market has changed dramatically
and there continues to be significant weakness in the global market for new PCs. This weakness had
a negative impact on our net sales in all of our PC-related categories. We believe that this weakness
reflects the growing popularity of tablets and smartphones as mobile computing devices.
We believe our future growth will be determined by our ability to rapidly create innovative products
across multiple digital platforms - especially accessories for mobility-related products, including tablets
and smartphones, gaming and digital music devices, to offset the decline in our PC peripherals. The
following discussion represents key trends specific to each of our two operating segments: peripherals
and video conferencing.
5
Annual Report Fiscal Year 2015