Logitech 2015 Annual Report Download - page 132
Download and view the complete annual report
Please find page 132 of the 2015 Logitech annual report below. You can navigate through the pages in the report by either clicking on the pages listed below, or by using the keyword search tool below to find specific information within the annual report.-
 1
1 -
2
-
3
-
4
-
5
-
6
-
7
-
8
-
9
-
10
-
11
-
12
-
13
-
14
-
15
-
16
-
17
-
18
-
19
-
20
-
21
-
22
-
23
-
24
-
25
-
26
-
27
-
28
-
29
-
30
-
31
-
32
-
33
-
34
-
35
-
36
-
37
-
38
-
39
-
40
-
41
-
42
-
43
-
44
-
45
-
46
-
47
-
48
-
49
-
50
-
51
-
52
-
53
-
54
-
55
-
56
-
57
-
58
-
59
-
60
-
61
-
62
-
63
-
64
-
65
-
66
-
67
-
68
-
69
-
70
-
71
-
72
-
73
-
74
-
75
-
76
-
77
-
78
-
79
-
80
-
81
-
82
-
83
-
84
-
85
-
86
-
87
-
88
-
89
-
90
-
91
-
92
-
93
-
94
-
95
-
96
-
97
-
98
-
99
-
100
-
101
-
102
-
103
-
104
-
105
-
106
-
107
-
108
-
109
-
110
-
111
-
112
-
113
-
114
-
115
-
116
-
117
-
118
-
119
-
120
-
121
-
 122
122 -
 123
123 -
 124
124 -
 125
125 -
 126
126 -
 127
127 -
 128
128 -
 129
129 -
 130
130 -
 131
131 -
 132
132 -
 133
133 -
 134
134 -
 135
135 -
 136
136 -
 137
137 -
 138
138 -
 139
139 -
 140
140 -
 141
141 -
 142
142 -
143
-
144
-
145
-
146
-
147
-
148
-
149
-
150
-
151
-
152
-
153
-
154
-
155
-
156
-
157
-
158
-
159
-
160
-
161
-
162
-
163
-
164
-
165
-
166
-
167
-
168
-
169
-
170
-
171
-
172
-
173
-
174
-
175
-
176
-
177
-
178
-
179
-
180
-
181
-
182
-
183
-
184
-
185
-
186
-
187
-
188
-
189
-
190
-
191
-
192
-
193
-
194
-
195
-
196
-
197
-
198
-
199
-
200
-
201
-
202
-
203
-
204
-
205
-
206
-
207
-
208
-
209
-
210
-
211
-
212
-
213
-
214
-
215
-
216
-
217
-
218
-
219
-
220
-
221
-
222
-
223
-
224
-
225
-
226
-
227
-
228
-
229
-
230
-
231
-
232
-
233
-
234
-
235
-
236
-
237
-
238
-
239
-
240
-
241
-
242
-
243
-
244
-
245
-
246
-
247
-
248
-
249
-
250
-
251
-
252
 |
 |

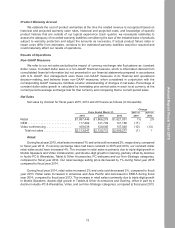
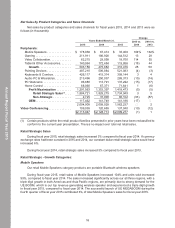
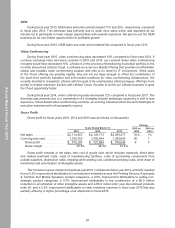
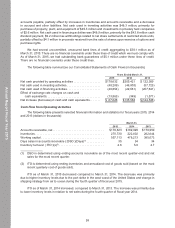
Net Sales by Product Categories and Sales Channels
Net sales by product categories and sales channels for fiscal years 2015, 2014 and 2013 were as
follows (in thousands):
Years Ended March 31,
Change
2015 vs.
2014
2014 vs.
20132015 2014 2013
Peripherals:
Mobile Speakers . . . . . . . . . . . . . . . $ 178,038 $ 87,414 $ 33,408 104% 162%
Gaming . . . . . . . . . . . . . . . . . . . . . . 211,911 186,926 144,512 13 29
Video Collaboration. . . . . . . . . . . . . 62,215 29,058 18,700 114 55
Tablet & Other Accessories. . . . . . . 140,994 172,484 119,856 (18) 44
Growth. . . . . . . . . . . . . . . . . . . . 593,158 475,882 316,476 25 50
Pointing Devices . . . . . . . . . . . . . . . 487,210 506,884 521,083 (4) (3)
Keyboards & Combos . . . . . . . . . . . 426,117 415,314 399,144 3 4
Audio-PC & Wearables. . . . . . . . . . 213,496 250,037 289,313 (15) (14)
PC Webcams . . . . . . . . . . . . . . . . . 96,680 113,791 137,292 (15) (17)
Home Control . . . . . . . . . . . . . . . . . 68,060 67,371 71,641 1 (6)
Profit Maximization . . . . . . . . . 1,291,563 1,353,397 1,418,473 (5) (5)
Retail Strategic Sales(1). . . . 1,884,721 1,829,279 1,734,949 3 5
Non-Strategic . . . . . . . . . . . 2,725 37,000 86,102 (93) (57)
OEM . . . . . . . . . . . . . . . . . . . . . . 117,462 141,749 141,186 (17) —
2,004,908 2,008,028 1,962,237 — 2
Video Conferencing . . . . . . . . . . . . . . 109,039 120,685 137,040 (10) (12)
$2,113,947 $2,128,713 $2,099,277 (1) 1
(1) Certain products within the retail product families presented in prior years have been reclassified to
conform to the current year presentation. There’s no impact over total net retail sales.
Retail Strategic Sales
During fiscal year 2015, retail strategic sales increased 3% compared to fiscal year 2014. If currency
exchange rates had been constant in 2015 and 2014, our constant dollar retail strategic sales would have
increased 6%.
During fiscal year 2014, retail strategic sales increased 5% compared to fiscal year 2013.
Retail Strategic - Growth Categories:
Mobile Speakers
Our retail Mobile Speakers category products are portable Bluetooth wireless speakers.
During fiscal year 2015, retail sales of Mobile Speakers increased 104% and units sold increased
99%, compared to fiscal year 2014. The sales increased significantly across our all three regions, with a
triple digit growth in both Americas and Asia Pacific regions, are primarily due to strong demand for the
UE BOOM, which is our top revenue generating wireless speaker and experienced a triple digit growth
in fiscal year 2015, compared to fiscal year 2014. The successful launch of UE MEGABOOM during the
fourth quarter of fiscal year 2015 contributed 6% of total Mobile Speakers sales for fiscal year 2015.
16
Annual Report Fiscal Year 2015