Logitech 2015 Annual Report Download - page 203
Download and view the complete annual report
Please find page 203 of the 2015 Logitech annual report below. You can navigate through the pages in the report by either clicking on the pages listed below, or by using the keyword search tool below to find specific information within the annual report.-
 1
1 -
2
-
3
-
4
-
5
-
6
-
7
-
8
-
9
-
10
-
11
-
12
-
13
-
14
-
15
-
16
-
17
-
18
-
19
-
20
-
21
-
22
-
23
-
24
-
25
-
26
-
27
-
28
-
29
-
30
-
31
-
32
-
33
-
34
-
35
-
36
-
37
-
38
-
39
-
40
-
41
-
42
-
43
-
44
-
45
-
46
-
47
-
48
-
49
-
50
-
51
-
52
-
53
-
54
-
55
-
56
-
57
-
58
-
59
-
60
-
61
-
62
-
63
-
64
-
65
-
66
-
67
-
68
-
69
-
70
-
71
-
72
-
73
-
74
-
75
-
76
-
77
-
78
-
79
-
80
-
81
-
82
-
83
-
84
-
85
-
86
-
87
-
88
-
89
-
90
-
91
-
92
-
93
-
94
-
95
-
96
-
97
-
98
-
99
-
100
-
101
-
102
-
103
-
104
-
105
-
106
-
107
-
108
-
109
-
110
-
111
-
112
-
113
-
114
-
115
-
116
-
117
-
118
-
119
-
120
-
121
-
122
-
123
-
124
-
125
-
126
-
127
-
128
-
129
-
130
-
131
-
132
-
133
-
134
-
135
-
136
-
137
-
138
-
139
-
140
-
141
-
142
-
143
-
144
-
145
-
146
-
147
-
148
-
149
-
150
-
151
-
152
-
153
-
154
-
155
-
156
-
157
-
158
-
159
-
160
-
161
-
162
-
163
-
164
-
165
-
166
-
167
-
168
-
169
-
170
-
171
-
172
-
173
-
174
-
175
-
176
-
177
-
178
-
179
-
180
-
181
-
182
-
183
-
184
-
185
-
186
-
187
-
188
-
189
-
190
-
191
-
192
-
 193
193 -
 194
194 -
 195
195 -
 196
196 -
 197
197 -
 198
198 -
 199
199 -
 200
200 -
 201
201 -
 202
202 -
 203
203 -
 204
204 -
 205
205 -
 206
206 -
 207
207 -
 208
208 -
 209
209 -
 210
210 -
 211
211 -
 212
212 -
 213
213 -
214
-
215
-
216
-
217
-
218
-
219
-
220
-
221
-
222
-
223
-
224
-
225
-
226
-
227
-
228
-
229
-
230
-
231
-
232
-
233
-
234
-
235
-
236
-
237
-
238
-
239
-
240
-
241
-
242
-
243
-
244
-
245
-
246
-
247
-
248
-
249
-
250
-
251
-
252
 |
 |

LOGITECH INTERNATIONAL S.A.
NOTES TO CONSOLIDATED FINANCIAL STATEMENTS (Continued)
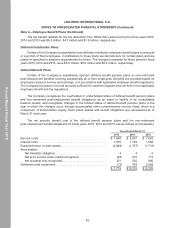
Recent Accounting Pronouncements
In May 2014, the FASB issued Accounting Standards Update No. 2014-9, “Revenue from Contracts
with Customers (Topic 606),” (“ASU 2014-9”). ASU 2014-9 outlines a new, single comprehensive model
for entities to use in accounting for revenue arising from contracts with customers and supersedes
most current revenue recognition guidance, including industry-specific guidance. Under the new model,
recognition of revenue occurs when a customer obtains control of promised goods or services in an
amount that reflects the consideration to which the entity expects to be entitled in exchange for those
goods or services. In addition, the new standard requires that reporting companies disclose the nature,
amount, timing, and uncertainty of revenue and cash flows arising from contracts with customers. As
currently issued, the new standard is effective beginning in the first quarter of 2017; early adoption is
prohibited. The new standard is required to be applied retrospectively to each prior reporting period
presented or retrospectively with the cumulative effect of initially applying it recognized at the date of
initial application. The Company has not yet selected a transition method nor has it determined the impact
of the new standard on its consolidated financial statements.
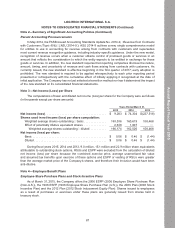
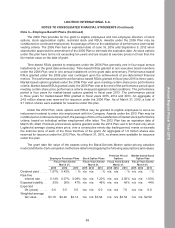
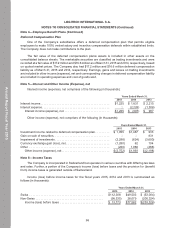
Note 3—Net Income (Loss) per Share
The computations of basic and diluted net income (loss) per share for the Company were as follows
(in thousands except per share amounts):
Years Ended March 31,
2015 2014 2013
Net income (loss) . . . . . . . . . . . . . . . . . . . . . . . . . . . . . . . . . . . . . . $ 9,283 $ 74,304 $(227,518)
Shares used in net income (loss) per share computation:
Weighted average shares outstanding—basic . . . . . . . . . . . . . . 163,536 160,619 158,468
Effect of potentially dilutive equivalent shares . . . . . . . . . . . . . . 2,638 1,907 —
Weighted average shares outstanding—diluted . . . . . . . . . . 166,174 162,526 158,468
Net income (loss) per share:
Basic . . . . . . . . . . . . . . . . . . . . . . . . . . . . . . . . . . . . . . . . . . . . . . $ 0.06 $ 0.46 $ (1.44)
Diluted . . . . . . . . . . . . . . . . . . . . . . . . . . . . . . . . . . . . . . . . . . . . . $ 0.06 $ 0.46 $ (1.44)
During fiscal years 2015, 2014 and 2013, 9.0 million, 15.1 million and 22.9 million share equivalents
attributable to outstanding stock options, RSUs and ESPP were excluded from the calculation of diluted
net income (loss) per share because the combined exercise price, average unamortized fair value
and assumed tax benefits upon exercise of these options and ESPP or vesting of RSUs were greater
than the average market price of the Company’s shares, and therefore their inclusion would have been
anti-dilutive.
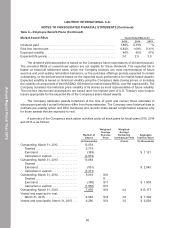
Note 4—Employee Benefit Plans
Employee Share Purchase Plans and Stock Incentive Plans
As of March 31, 2015, the Company offers the 2006 ESPP (2006 Employee Share Purchase Plan
(Non-U.S.)), the 1996 ESPP (1996 Employee Share Purchase Plan (U.S.)), the 2006 Plan (2006 Stock
Incentive Plan) and the 2012 Plan (2012 Stock Inducement Equity Plan). Shares issued to employees
as a result of purchases or exercises under these plans are generally issued from shares held in
treasury stock.
Note 2—Summary of Significant Accounting Policies (Continued)
87
Annual Report Fiscal Year 2015