Logitech 2015 Annual Report Download - page 211
Download and view the complete annual report
Please find page 211 of the 2015 Logitech annual report below. You can navigate through the pages in the report by either clicking on the pages listed below, or by using the keyword search tool below to find specific information within the annual report.-
 1
1 -
2
-
3
-
4
-
5
-
6
-
7
-
8
-
9
-
10
-
11
-
12
-
13
-
14
-
15
-
16
-
17
-
18
-
19
-
20
-
21
-
22
-
23
-
24
-
25
-
26
-
27
-
28
-
29
-
30
-
31
-
32
-
33
-
34
-
35
-
36
-
37
-
38
-
39
-
40
-
41
-
42
-
43
-
44
-
45
-
46
-
47
-
48
-
49
-
50
-
51
-
52
-
53
-
54
-
55
-
56
-
57
-
58
-
59
-
60
-
61
-
62
-
63
-
64
-
65
-
66
-
67
-
68
-
69
-
70
-
71
-
72
-
73
-
74
-
75
-
76
-
77
-
78
-
79
-
80
-
81
-
82
-
83
-
84
-
85
-
86
-
87
-
88
-
89
-
90
-
91
-
92
-
93
-
94
-
95
-
96
-
97
-
98
-
99
-
100
-
101
-
102
-
103
-
104
-
105
-
106
-
107
-
108
-
109
-
110
-
111
-
112
-
113
-
114
-
115
-
116
-
117
-
118
-
119
-
120
-
121
-
122
-
123
-
124
-
125
-
126
-
127
-
128
-
129
-
130
-
131
-
132
-
133
-
134
-
135
-
136
-
137
-
138
-
139
-
140
-
141
-
142
-
143
-
144
-
145
-
146
-
147
-
148
-
149
-
150
-
151
-
152
-
153
-
154
-
155
-
156
-
157
-
158
-
159
-
160
-
161
-
162
-
163
-
164
-
165
-
166
-
167
-
168
-
169
-
170
-
171
-
172
-
173
-
174
-
175
-
176
-
177
-
178
-
179
-
180
-
181
-
182
-
183
-
184
-
185
-
186
-
187
-
188
-
189
-
190
-
191
-
192
-
193
-
194
-
195
-
196
-
197
-
198
-
199
-
200
-
 201
201 -
 202
202 -
 203
203 -
 204
204 -
 205
205 -
 206
206 -
 207
207 -
 208
208 -
 209
209 -
 210
210 -
 211
211 -
 212
212 -
 213
213 -
 214
214 -
 215
215 -
 216
216 -
 217
217 -
 218
218 -
 219
219 -
 220
220 -
 221
221 -
222
-
223
-
224
-
225
-
226
-
227
-
228
-
229
-
230
-
231
-
232
-
233
-
234
-
235
-
236
-
237
-
238
-
239
-
240
-
241
-
242
-
243
-
244
-
245
-
246
-
247
-
248
-
249
-
250
-
251
-
252
 |
 |

LOGITECH INTERNATIONAL S.A.
NOTES TO CONSOLIDATED FINANCIAL STATEMENTS (Continued)
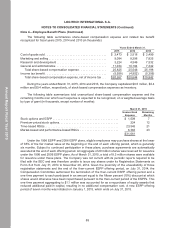
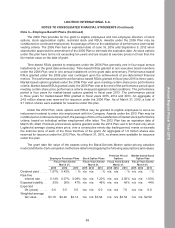
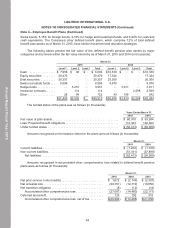
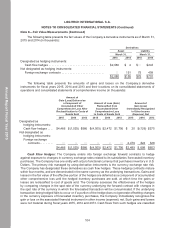
The following table presents the amounts included in accumulated other comprehensive loss as of
March 31, 2015, which are expected to be recognized as a component of net periodic benefit cost in fiscal
year 2016 (in thousands):
Year Ending
March 31, 2016
Amortization of net transition obligation . . . . . . . . . . . . . . . . . . . . . . . . . . . . . . . . . . . . . . $ 4
Amortization of net prior service credits . . . . . . . . . . . . . . . . . . . . . . . . . . . . . . . . . . . . . . (121)
Amortization of net actuarial loss . . . . . . . . . . . . . . . . . . . . . . . . . . . . . . . . . . . . . . . . . . . 1,750
$1,633
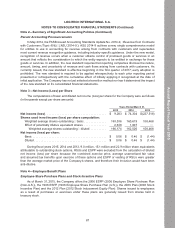
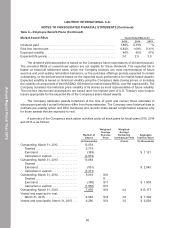
The Company reassesses its benefit plan assumptions on a regular basis. The actuarial assumptions
for the defined benefit plans for fiscal years 2015 and 2014 were as follows:
Years Ended March 31,
2015 2014
Benefit Obligations:
Discount rate . . . . . . . . . . . . . . . . . . . . . . . . . . . . . . . . . . . . . . . . . . . . 0.75%-7.75% 1.50%-9.25%
Estimated rate of compensation increase . . . . . . . . . . . . . . . . . . . . . . 2.50%-8.00% 3.00%-8.00%
Periodic Costs:
Discount rate . . . . . . . . . . . . . . . . . . . . . . . . . . . . . . . . . . . . . . . . . . . . 1.50%-9.25% 1.50%-8.00%
Estimated rate of compensation increase . . . . . . . . . . . . . . . . . . . . . . 2.50%-8.00% 3.00%-4.00%
Expected average rate of return on plan assets . . . . . . . . . . . . . . . . . 0.75%-3.50% 0.75%-3.50%
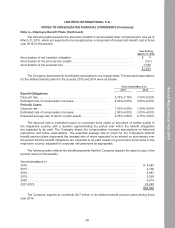
The discount rate is estimated based on corporate bond yields or securities of similar quality in
the respective country, with a duration approximating the period over which the benefit obligations
are expected to be paid. The Company bases the compensation increase assumptions on historical
experience and future expectations. The expected average rate of return for the Company’s defined
benefit pension plans represents the average rate of return expected to be earned on plan assets over
the period that the benefit obligations are expected to be paid, based on government bond notes in the
respective country, adjusted for corporate risk premiums as appropriate.
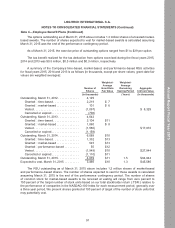
The following table reflects the benefit payments that the Company expects the plans to pay in the
periods noted (in thousands):
Years Ending March 31,
2016 . . . . . . . . . . . . . . . . . . . . . . . . . . . . . . . . . . . . . . . . . . . . . . . . . . . . . . . . . . . . . . . . . . . . . $ 4,583
2017 . . . . . . . . . . . . . . . . . . . . . . . . . . . . . . . . . . . . . . . . . . . . . . . . . . . . . . . . . . . . . . . . . . . . . 4,790
2018 . . . . . . . . . . . . . . . . . . . . . . . . . . . . . . . . . . . . . . . . . . . . . . . . . . . . . . . . . . . . . . . . . . . . . 4,987
2019 . . . . . . . . . . . . . . . . . . . . . . . . . . . . . . . . . . . . . . . . . . . . . . . . . . . . . . . . . . . . . . . . . . . . . 5,329
2020 . . . . . . . . . . . . . . . . . . . . . . . . . . . . . . . . . . . . . . . . . . . . . . . . . . . . . . . . . . . . . . . . . . . . 6,014
2021-2025 . . . . . . . . . . . . . . . . . . . . . . . . . . . . . . . . . . . . . . . . . . . . . . . . . . . . . . . . . . . . . . . . 29,245
$54,948
The Company expects to contribute $4.7 million to its defined benefit pension plans during fiscal
year 2016.
Note 4—Employee Benefit Plans (Continued)
95
Annual Report Fiscal Year 2015