Logitech 2015 Annual Report Download - page 131
Download and view the complete annual report
Please find page 131 of the 2015 Logitech annual report below. You can navigate through the pages in the report by either clicking on the pages listed below, or by using the keyword search tool below to find specific information within the annual report.-
 1
1 -
2
-
3
-
4
-
5
-
6
-
7
-
8
-
9
-
10
-
11
-
12
-
13
-
14
-
15
-
16
-
17
-
18
-
19
-
20
-
21
-
22
-
23
-
24
-
25
-
26
-
27
-
28
-
29
-
30
-
31
-
32
-
33
-
34
-
35
-
36
-
37
-
38
-
39
-
40
-
41
-
42
-
43
-
44
-
45
-
46
-
47
-
48
-
49
-
50
-
51
-
52
-
53
-
54
-
55
-
56
-
57
-
58
-
59
-
60
-
61
-
62
-
63
-
64
-
65
-
66
-
67
-
68
-
69
-
70
-
71
-
72
-
73
-
74
-
75
-
76
-
77
-
78
-
79
-
80
-
81
-
82
-
83
-
84
-
85
-
86
-
87
-
88
-
89
-
90
-
91
-
92
-
93
-
94
-
95
-
96
-
97
-
98
-
99
-
100
-
101
-
102
-
103
-
104
-
105
-
106
-
107
-
108
-
109
-
110
-
111
-
112
-
113
-
114
-
115
-
116
-
117
-
118
-
119
-
120
-
 121
121 -
 122
122 -
 123
123 -
 124
124 -
 125
125 -
 126
126 -
 127
127 -
 128
128 -
 129
129 -
 130
130 -
 131
131 -
 132
132 -
 133
133 -
 134
134 -
 135
135 -
 136
136 -
 137
137 -
 138
138 -
 139
139 -
 140
140 -
 141
141 -
142
-
143
-
144
-
145
-
146
-
147
-
148
-
149
-
150
-
151
-
152
-
153
-
154
-
155
-
156
-
157
-
158
-
159
-
160
-
161
-
162
-
163
-
164
-
165
-
166
-
167
-
168
-
169
-
170
-
171
-
172
-
173
-
174
-
175
-
176
-
177
-
178
-
179
-
180
-
181
-
182
-
183
-
184
-
185
-
186
-
187
-
188
-
189
-
190
-
191
-
192
-
193
-
194
-
195
-
196
-
197
-
198
-
199
-
200
-
201
-
202
-
203
-
204
-
205
-
206
-
207
-
208
-
209
-
210
-
211
-
212
-
213
-
214
-
215
-
216
-
217
-
218
-
219
-
220
-
221
-
222
-
223
-
224
-
225
-
226
-
227
-
228
-
229
-
230
-
231
-
232
-
233
-
234
-
235
-
236
-
237
-
238
-
239
-
240
-
241
-
242
-
243
-
244
-
245
-
246
-
247
-
248
-
249
-
250
-
251
-
252
 |
 |

During fiscal year 2014, retail sales in Americas increased 9%, compared to fiscal year 2013.
Retail sales increased in Mobile Speakers, Gaming, Tablet & Other Accessories, Keyboards & Combos
and Pointing Devices, partially offset by decreases in Non-Strategic, Audio-PC & Wearables, Home
Control, and PC Webcams. The increase in Tablet & Other Accessories was led by sales of our Ultrathin
Keyboard Cover for the iPad and from our recently introduced Keyboard Folio suite of products designed
for the iPad, iPad mini and iPad Air. The increase in Mobile Speakers was primarily from the UE BOOM.
The increase in Gaming was due to the recent launch of our new gaming products. The increase in
Keyboards & Combos was driven by low-end, mid-range and high-end products. Retail sales improved in
the United States and Canada during fiscal year 2014, compared to fiscal year 2013.
EMEA
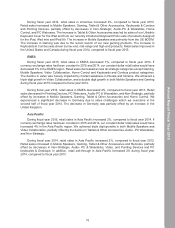
During fiscal year 2015, retail sales in EMEA decreased 7%, compared to fiscal year 2014. If
currency exchange rates had been constant in 2015 and 2014, our constant dollar retail sales would have
decreased 3% in the EMEA region. Retail sales decreased across all strategic categories except Gaming,
Mobile Speakers, Video Collaboration, Home Control and Keyboards and Combos product categories.
The decline in sales was heavily impacted by market weakness in Russia and Ukraine. We achieved a
triple digit growth in Video Collaboration, and a double digit growth in both Mobile Speakers and Gaming
during fiscal year 2015 compared to fiscal year 2014.
During fiscal year 2014, retail sales in EMEA decreased 4%, compared to fiscal year 2013. Retail
sales decreased in Pointing Devices, PC Webcams, Audio-PC & Wearables, and Non-Strategic, partially
offset by increases in Mobile Speakers, Gaming, Tablet & Other Accessories and Home Control. We
experienced a significant decrease in Germany due to sales challenges which we overcame in the
second half of fiscal year 2014. The decrease in Germany was partially offset by an increase in the
United Kingdom.
Asia Pacific
During fiscal year 2015, retail sales in Asia Pacific increased 2%, compared to fiscal year 2014. If
currency exchange rates had been constant in 2015 and 2014, our constant dollar retail sales would have
increased 4% in the Asia Pacific region. We achieved triple digit growths in both Mobile Speakers and
Video Collaboration, partially offset by the decline in Tablets & Other Accessories, Audio - PC Wearables,
and Non-Strategic.
During fiscal year 2014, retail sales in Asia Pacific increased 2%, compared to fiscal year 2013.
Retail sales increased in Mobile Speakers, Gaming, Tablet & Other Accessories and Remotes, partially
offset by decreases in Non-Strategic, Audio- PC & Wearables, Video, and Pointing Devices and PC
keyboards & Desktops. In addition, retail sell-through in Asia Pacific increased 2% during fiscal year
2014, compared to fiscal year 2013.
15
Annual Report Fiscal Year 2015