Logitech 2015 Annual Report Download - page 190
Download and view the complete annual report
Please find page 190 of the 2015 Logitech annual report below. You can navigate through the pages in the report by either clicking on the pages listed below, or by using the keyword search tool below to find specific information within the annual report.-
 1
1 -
2
-
3
-
4
-
5
-
6
-
7
-
8
-
9
-
10
-
11
-
12
-
13
-
14
-
15
-
16
-
17
-
18
-
19
-
20
-
21
-
22
-
23
-
24
-
25
-
26
-
27
-
28
-
29
-
30
-
31
-
32
-
33
-
34
-
35
-
36
-
37
-
38
-
39
-
40
-
41
-
42
-
43
-
44
-
45
-
46
-
47
-
48
-
49
-
50
-
51
-
52
-
53
-
54
-
55
-
56
-
57
-
58
-
59
-
60
-
61
-
62
-
63
-
64
-
65
-
66
-
67
-
68
-
69
-
70
-
71
-
72
-
73
-
74
-
75
-
76
-
77
-
78
-
79
-
80
-
81
-
82
-
83
-
84
-
85
-
86
-
87
-
88
-
89
-
90
-
91
-
92
-
93
-
94
-
95
-
96
-
97
-
98
-
99
-
100
-
101
-
102
-
103
-
104
-
105
-
106
-
107
-
108
-
109
-
110
-
111
-
112
-
113
-
114
-
115
-
116
-
117
-
118
-
119
-
120
-
121
-
122
-
123
-
124
-
125
-
126
-
127
-
128
-
129
-
130
-
131
-
132
-
133
-
134
-
135
-
136
-
137
-
138
-
139
-
140
-
141
-
142
-
143
-
144
-
145
-
146
-
147
-
148
-
149
-
150
-
151
-
152
-
153
-
154
-
155
-
156
-
157
-
158
-
159
-
160
-
161
-
162
-
163
-
164
-
165
-
166
-
167
-
168
-
169
-
170
-
171
-
172
-
173
-
174
-
175
-
176
-
177
-
178
-
179
-
 180
180 -
 181
181 -
 182
182 -
 183
183 -
 184
184 -
 185
185 -
 186
186 -
 187
187 -
 188
188 -
 189
189 -
 190
190 -
 191
191 -
 192
192 -
 193
193 -
 194
194 -
 195
195 -
 196
196 -
 197
197 -
 198
198 -
 199
199 -
 200
200 -
201
-
202
-
203
-
204
-
205
-
206
-
207
-
208
-
209
-
210
-
211
-
212
-
213
-
214
-
215
-
216
-
217
-
218
-
219
-
220
-
221
-
222
-
223
-
224
-
225
-
226
-
227
-
228
-
229
-
230
-
231
-
232
-
233
-
234
-
235
-
236
-
237
-
238
-
239
-
240
-
241
-
242
-
243
-
244
-
245
-
246
-
247
-
248
-
249
-
250
-
251
-
252
 |
 |

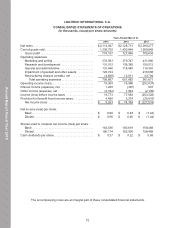
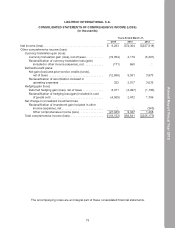
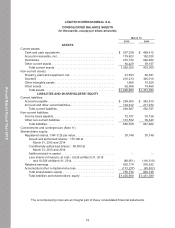
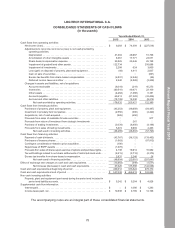
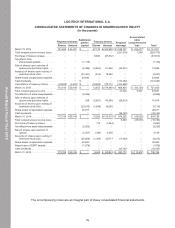
The accompanying notes are an integral part of these consolidated financial statements.
LOGITECH INTERNATIONAL S.A.
CONSOLIDATED BALANCE SHEETS
(In thousands, except per share amounts)
March 31,
2015 2014
ASSETS
Current assets:
Cash and cash equivalents. . . . . . . . . . . . . . . . . . . . . . . . . . . . . . . . . . $ 537,038 $ 469,412
Accounts receivable, net. . . . . . . . . . . . . . . . . . . . . . . . . . . . . . . . . . . . 179,823 182,029
Inventories. . . . . . . . . . . . . . . . . . . . . . . . . . . . . . . . . . . . . . . . . . . . . . . 270,730 222,402
Other current assets . . . . . . . . . . . . . . . . . . . . . . . . . . . . . . . . . . . . . . . 64,429 59,157
Total current assets . . . . . . . . . . . . . . . . . . . . . . . . . . . . . . . . . . . . . 1,052,020 933,000
Non-current assets:
Property, plant and equipment, net . . . . . . . . . . . . . . . . . . . . . . . . . . . . 91,593 88,391
Goodwill . . . . . . . . . . . . . . . . . . . . . . . . . . . . . . . . . . . . . . . . . . . . . . . . 218,213 345,010
Other intangible assets . . . . . . . . . . . . . . . . . . . . . . . . . . . . . . . . . . . . . 1,866 10,529
Other assets . . . . . . . . . . . . . . . . . . . . . . . . . . . . . . . . . . . . . . . . . . . . . 62,988 74,460
Total assets . . . . . . . . . . . . . . . . . . . . . . . . . . . . . . . . . . . . . . . . . . . $1,426,680 $1,451,390
LIABILITIES AND SHAREHOLDERS’ EQUITY
Current liabilities:
Accounts payable . . . . . . . . . . . . . . . . . . . . . . . . . . . . . . . . . . . . . . . . . $ 299,995 $ 242,815
Accrued and other current liabilities . . . . . . . . . . . . . . . . . . . . . . . . . . . 194,912 211,972
Total current liabilities. . . . . . . . . . . . . . . . . . . . . . . . . . . . . . . . . . . . 494,907 454,787
Non-current liabilities:
Income taxes payable . . . . . . . . . . . . . . . . . . . . . . . . . . . . . . . . . . . . . . 72,107 93,126
Other non-current liabilities. . . . . . . . . . . . . . . . . . . . . . . . . . . . . . . . . . 101,532 99,349
Total liabilities. . . . . . . . . . . . . . . . . . . . . . . . . . . . . . . . . . . . . . . . . . 668,546 647,262
Commitments and contingencies (Note 11)
Shareholders’ equity:
Registered shares, CHF 0.25 par value:. . . . . . . . . . . . . . . . . . . . . . . . 30,148 30,148
Issued and authorized shares—173,106 at
March 31, 2015 and 2014
Conditionally authorized shares—50,000 at
March 31, 2015 and 2014
Additional paid-in capital . . . . . . . . . . . . . . . . . . . . . . . . . . . . . . . . . — —
Less shares in treasury, at cost—8,625 at March 31, 2015
and 10,206 at March 31, 2014. . . . . . . . . . . . . . . . . . . . . . . . . . . (88,951) (116,510)
Retained earnings . . . . . . . . . . . . . . . . . . . . . . . . . . . . . . . . . . . . . . . . . 930,174 976,292
Accumulated other comprehensive loss . . . . . . . . . . . . . . . . . . . . . . . . (113,237) (85,802)
Total shareholders’ equity . . . . . . . . . . . . . . . . . . . . . . . . . . . . . . . . 758,134 804,128
Total liabilities and shareholders’ equity . . . . . . . . . . . . . . . . . . . . . $1,426,680 $1,451,390
74
Annual Report Fiscal Year 2015