Logitech 2015 Annual Report Download - page 155
Download and view the complete annual report
Please find page 155 of the 2015 Logitech annual report below. You can navigate through the pages in the report by either clicking on the pages listed below, or by using the keyword search tool below to find specific information within the annual report.-
 1
1 -
2
-
3
-
4
-
5
-
6
-
7
-
8
-
9
-
10
-
11
-
12
-
13
-
14
-
15
-
16
-
17
-
18
-
19
-
20
-
21
-
22
-
23
-
24
-
25
-
26
-
27
-
28
-
29
-
30
-
31
-
32
-
33
-
34
-
35
-
36
-
37
-
38
-
39
-
40
-
41
-
42
-
43
-
44
-
45
-
46
-
47
-
48
-
49
-
50
-
51
-
52
-
53
-
54
-
55
-
56
-
57
-
58
-
59
-
60
-
61
-
62
-
63
-
64
-
65
-
66
-
67
-
68
-
69
-
70
-
71
-
72
-
73
-
74
-
75
-
76
-
77
-
78
-
79
-
80
-
81
-
82
-
83
-
84
-
85
-
86
-
87
-
88
-
89
-
90
-
91
-
92
-
93
-
94
-
95
-
96
-
97
-
98
-
99
-
100
-
101
-
102
-
103
-
104
-
105
-
106
-
107
-
108
-
109
-
110
-
111
-
112
-
113
-
114
-
115
-
116
-
117
-
118
-
119
-
120
-
121
-
122
-
123
-
124
-
125
-
126
-
127
-
128
-
129
-
130
-
131
-
132
-
133
-
134
-
135
-
136
-
137
-
138
-
139
-
140
-
141
-
142
-
143
-
144
-
 145
145 -
 146
146 -
 147
147 -
 148
148 -
 149
149 -
 150
150 -
 151
151 -
 152
152 -
 153
153 -
 154
154 -
 155
155 -
 156
156 -
 157
157 -
 158
158 -
 159
159 -
 160
160 -
 161
161 -
 162
162 -
 163
163 -
 164
164 -
 165
165 -
166
-
167
-
168
-
169
-
170
-
171
-
172
-
173
-
174
-
175
-
176
-
177
-
178
-
179
-
180
-
181
-
182
-
183
-
184
-
185
-
186
-
187
-
188
-
189
-
190
-
191
-
192
-
193
-
194
-
195
-
196
-
197
-
198
-
199
-
200
-
201
-
202
-
203
-
204
-
205
-
206
-
207
-
208
-
209
-
210
-
211
-
212
-
213
-
214
-
215
-
216
-
217
-
218
-
219
-
220
-
221
-
222
-
223
-
224
-
225
-
226
-
227
-
228
-
229
-
230
-
231
-
232
-
233
-
234
-
235
-
236
-
237
-
238
-
239
-
240
-
241
-
242
-
243
-
244
-
245
-
246
-
247
-
248
-
249
-
250
-
251
-
252
 |
 |

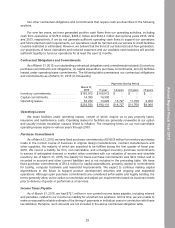
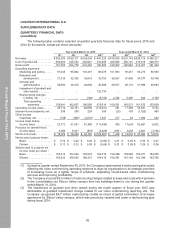
(1) Impairment of goodwill and other assets during fiscal year 2015 was attributable to a goodwill
impairment charge related to our video conferencing reporting unit. Impairment of goodwill and other
assets during fiscal year 2013 was primarily attributable to a $214.5 million goodwill impairment
charge related to our video conferencing reporting unit.
(2) The $4.9 million in restructuring credits during fiscal year 2015 were related to restructuring plans
we implemented in fiscal year 2014. The $13.8 million and $43.7 million in restructuring costs during
fiscal years 2014 and 2013 were related to restructuring plans we implemented in fiscal years 2014
and 2013.
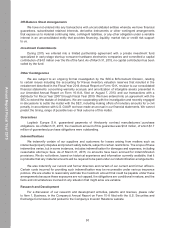
QUANTITATIVE AND QUALITATIVE DISCLOSURES ABOUT MARKET RISK
Market Risk
Market risk represents the potential for loss due to adverse changes in the fair value of financial
instruments. As a global concern, we face exposure to adverse movements in currency exchange rates
and interest rates. These exposures may change over time as business practices evolve and could have
a material adverse impact on our financial results.
Currency Exchange Rates
We report our results in U.S. Dollars. Changes in currency exchange rates compared to the
U.S. Dollar can have a material impact on our results when the financial statements of our non-U.S.
subsidiaries are translated into U.S. Dollars. The functional currency of our operations is primarily the
U.S. Dollar. Certain operations use the Swiss Franc, or the local currency of the country as their functional
currencies. Accordingly, unrealized currency gains or losses resulting from the translation of net assets or
liabilities denominated in other currencies to the U.S. Dollar are accumulated in the cumulative translation
adjustment component of other comprehensive income (loss) in shareholders’ equity.
We are exposed to currency exchange rate risk as we transact business in multiple currencies,
including exposure related to anticipated sales, anticipated purchases and assets and liabilities
denominated in currencies other than the U.S. Dollar. We transact business in over 30 currencies
worldwide, of which the most significant to operations are the Euro, Chinese Renminbi, Australian Dollar,
Taiwanese Dollar, British Pound, Canadian Dollar, Japanese Yen and Mexican Peso. For example, for the
year ended March 31, 2015, approximately 44% of our sales were in non-U.S. denominated currencies,
with 23% of our sales denominated in Euro. The mix of our cost of goods sold and operating expenses
by currency are significantly different from the mix of our sales, with a larger portion denominated in U.S.
Dollar and less denominated in Euro and other currencies. As a result, a strengthening U.S. Dollar has an
adverse impact on our operating results. The average exchange rate for the U.S. Dollar for the year ended
March 31, 2015 strengthened significantly against most of the currencies for the same period in the prior
fiscal year, which adversely impacted our actual results for the year ended March 31, 2015 including our
net sales, net income, cash flows from operations and our growth rates year over year. If the U.S. Dollar
remains at its current strong levels in comparison to other currencies, this will affect our results of operations
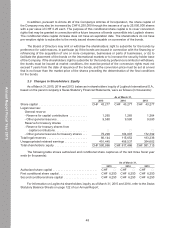
in future periods as well. The table below provides information about our underlying transactions that are
sensitive to currency exchange rate changes, primarily assets and liabilities denominated in currencies
39
Annual Report Fiscal Year 2015