Logitech 2015 Annual Report Download - page 207
Download and view the complete annual report
Please find page 207 of the 2015 Logitech annual report below. You can navigate through the pages in the report by either clicking on the pages listed below, or by using the keyword search tool below to find specific information within the annual report.-
 1
1 -
2
-
3
-
4
-
5
-
6
-
7
-
8
-
9
-
10
-
11
-
12
-
13
-
14
-
15
-
16
-
17
-
18
-
19
-
20
-
21
-
22
-
23
-
24
-
25
-
26
-
27
-
28
-
29
-
30
-
31
-
32
-
33
-
34
-
35
-
36
-
37
-
38
-
39
-
40
-
41
-
42
-
43
-
44
-
45
-
46
-
47
-
48
-
49
-
50
-
51
-
52
-
53
-
54
-
55
-
56
-
57
-
58
-
59
-
60
-
61
-
62
-
63
-
64
-
65
-
66
-
67
-
68
-
69
-
70
-
71
-
72
-
73
-
74
-
75
-
76
-
77
-
78
-
79
-
80
-
81
-
82
-
83
-
84
-
85
-
86
-
87
-
88
-
89
-
90
-
91
-
92
-
93
-
94
-
95
-
96
-
97
-
98
-
99
-
100
-
101
-
102
-
103
-
104
-
105
-
106
-
107
-
108
-
109
-
110
-
111
-
112
-
113
-
114
-
115
-
116
-
117
-
118
-
119
-
120
-
121
-
122
-
123
-
124
-
125
-
126
-
127
-
128
-
129
-
130
-
131
-
132
-
133
-
134
-
135
-
136
-
137
-
138
-
139
-
140
-
141
-
142
-
143
-
144
-
145
-
146
-
147
-
148
-
149
-
150
-
151
-
152
-
153
-
154
-
155
-
156
-
157
-
158
-
159
-
160
-
161
-
162
-
163
-
164
-
165
-
166
-
167
-
168
-
169
-
170
-
171
-
172
-
173
-
174
-
175
-
176
-
177
-
178
-
179
-
180
-
181
-
182
-
183
-
184
-
185
-
186
-
187
-
188
-
189
-
190
-
191
-
192
-
193
-
194
-
195
-
196
-
 197
197 -
 198
198 -
 199
199 -
 200
200 -
 201
201 -
 202
202 -
 203
203 -
 204
204 -
 205
205 -
 206
206 -
 207
207 -
 208
208 -
 209
209 -
 210
210 -
 211
211 -
 212
212 -
 213
213 -
 214
214 -
 215
215 -
 216
216 -
 217
217 -
218
-
219
-
220
-
221
-
222
-
223
-
224
-
225
-
226
-
227
-
228
-
229
-
230
-
231
-
232
-
233
-
234
-
235
-
236
-
237
-
238
-
239
-
240
-
241
-
242
-
243
-
244
-
245
-
246
-
247
-
248
-
249
-
250
-
251
-
252
 |
 |

LOGITECH INTERNATIONAL S.A.
NOTES TO CONSOLIDATED FINANCIAL STATEMENTS (Continued)
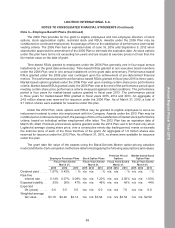
The options outstanding as of March 31, 2015 above includes 1.3 million shares of unvested market-
based awards. The number of shares expected to vest for market-based awards is calculated assuming
March 31, 2015 was the end of the performance contingency period.
As of March 31, 2015, the exercise price of outstanding options ranged from $1 to $39 per option.
The tax benefit realized for the tax deduction from options exercised during the fiscal years 2015,
2014 and 2013 was $0.5 million, $0.5 million and $0.3 million, respectively.
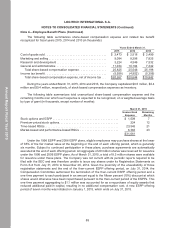
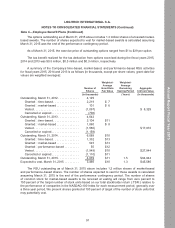
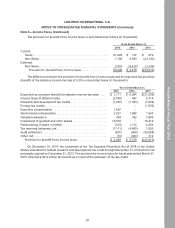
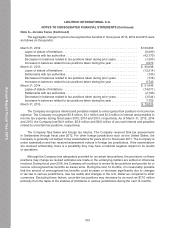
A summary of the Company’s time-based, market-based, and performance-based RSU activities
for fiscal years 2015, 2014 and 2013 is as follows (in thousands, except per share values; grant-date fair
values are weighted averages):
Number of
Shares
Weighted-
Average
Grant Date
Fair Value
Weighted-
Average
Remaining
Vesting Period
Aggregate
Intrinsic Value
(In thousands) (Years) (In thousands)
Outstanding, March 31, 2012 . . . . . . . . . . . . . 4,125
Granted—time-based . . . . . . . . . . . . . . . . 2,219 $ 7
Granted—market-based . . . . . . . . . . . . . . 101 $ 6
Vested . . . . . . . . . . . . . . . . . . . . . . . . . . . . (1,097) $ 8,329
Cancelled or expired . . . . . . . . . . . . . . . . . (706)
Outstanding, March 31, 2013 . . . . . . . . . . . . . 4,642
Granted—time-based . . . . . . . . . . . . . . . . 3,104 $11
Granted—market-based . . . . . . . . . . . . . . 1,060 $ 8
Vested . . . . . . . . . . . . . . . . . . . . . . . . . . . . (1,560) $17,810
Cancelled or expired . . . . . . . . . . . . . . . . . (1,158)
Outstanding, March 31, 2014 . . . . . . . . . . . . . 6,088 $10
Granted—time-based . . . . . . . . . . . . . . . . 1,332 $13
Granted—market-based . . . . . . . . . . . . . . 523 $13
Granted—performance-based . . . . . . . . . 55 $12
Vested . . . . . . . . . . . . . . . . . . . . . . . . . . . . (1,949) $10 $27,844
Cancelled or expired . . . . . . . . . . . . . . . . . (1,110) $11
Outstanding, March 31, 2015 . . . . . . . . . . . . . 4,939 $11 1.5 $64,944
Expected to vest, March 31, 2015 . . . . . . . . . 3,466 $10 1.3 $45,580
The RSU outstanding as of March 31, 2015 above includes 1.2 million shares of market-based
and performance-based shares. The number of shares expected to vest for these awards is calculated
assuming March 31, 2015 is the end of the performance contingency period. The number of shares
of common stock for market-based awards to be received at vesting will range from zero percent to
150 percent of the target number of stock units based on our total stockholder return (“TSR”) relative to
the performance of companies in the NASDAQ-100 Index for each measurement period, generally over
a three year period. We present shares granted at 100 percent of target of the number of stock units that
may potentially vest.
Note 4—Employee Benefit Plans (Continued)
91
Annual Report Fiscal Year 2015