Logitech 2015 Annual Report Download - page 137
Download and view the complete annual report
Please find page 137 of the 2015 Logitech annual report below. You can navigate through the pages in the report by either clicking on the pages listed below, or by using the keyword search tool below to find specific information within the annual report.-
 1
1 -
2
-
3
-
4
-
5
-
6
-
7
-
8
-
9
-
10
-
11
-
12
-
13
-
14
-
15
-
16
-
17
-
18
-
19
-
20
-
21
-
22
-
23
-
24
-
25
-
26
-
27
-
28
-
29
-
30
-
31
-
32
-
33
-
34
-
35
-
36
-
37
-
38
-
39
-
40
-
41
-
42
-
43
-
44
-
45
-
46
-
47
-
48
-
49
-
50
-
51
-
52
-
53
-
54
-
55
-
56
-
57
-
58
-
59
-
60
-
61
-
62
-
63
-
64
-
65
-
66
-
67
-
68
-
69
-
70
-
71
-
72
-
73
-
74
-
75
-
76
-
77
-
78
-
79
-
80
-
81
-
82
-
83
-
84
-
85
-
86
-
87
-
88
-
89
-
90
-
91
-
92
-
93
-
94
-
95
-
96
-
97
-
98
-
99
-
100
-
101
-
102
-
103
-
104
-
105
-
106
-
107
-
108
-
109
-
110
-
111
-
112
-
113
-
114
-
115
-
116
-
117
-
118
-
119
-
120
-
121
-
122
-
123
-
124
-
125
-
126
-
 127
127 -
 128
128 -
 129
129 -
 130
130 -
 131
131 -
 132
132 -
 133
133 -
 134
134 -
 135
135 -
 136
136 -
 137
137 -
 138
138 -
 139
139 -
 140
140 -
 141
141 -
 142
142 -
 143
143 -
 144
144 -
 145
145 -
 146
146 -
 147
147 -
148
-
149
-
150
-
151
-
152
-
153
-
154
-
155
-
156
-
157
-
158
-
159
-
160
-
161
-
162
-
163
-
164
-
165
-
166
-
167
-
168
-
169
-
170
-
171
-
172
-
173
-
174
-
175
-
176
-
177
-
178
-
179
-
180
-
181
-
182
-
183
-
184
-
185
-
186
-
187
-
188
-
189
-
190
-
191
-
192
-
193
-
194
-
195
-
196
-
197
-
198
-
199
-
200
-
201
-
202
-
203
-
204
-
205
-
206
-
207
-
208
-
209
-
210
-
211
-
212
-
213
-
214
-
215
-
216
-
217
-
218
-
219
-
220
-
221
-
222
-
223
-
224
-
225
-
226
-
227
-
228
-
229
-
230
-
231
-
232
-
233
-
234
-
235
-
236
-
237
-
238
-
239
-
240
-
241
-
242
-
243
-
244
-
245
-
246
-
247
-
248
-
249
-
250
-
251
-
252
 |
 |

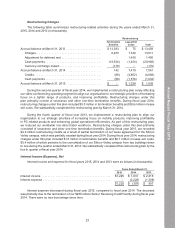
The increase in gross margin during fiscal year 2014, compared to fiscal year 2013, was primarily
due to cost improvements across all PC-related categories, actions we took since fiscal year 2013 to
streamline our product portfolio, inventory reserves of several discontinued Music category products and
the discontinuation of projects in 2013 due to restructuring.
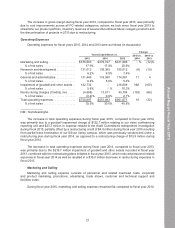
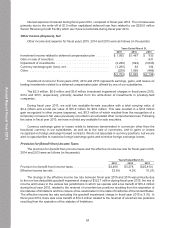
Operating Expenses
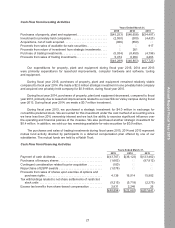
Operating expenses for fiscal years 2015, 2014 and 2013 were as follows (in thousands):
Years Ended March 31,
Change
2015 vs.
2014
2014 vs.
20132015 2014 2013
Marketing and selling . . . . . . . . . . . . . . . . . $378,593 $379,747 $431,886 —% (12)%
% of net sales . . . . . . . . . . . . . . . . . . . . 17.9% 17.8% 20.6%
Research and development . . . . . . . . . . . . 131,012 139,385 155,012 (6) (10)
% of net sales . . . . . . . . . . . . . . . . . . . . 6.2% 6.5% 7.4%
General and administrative . . . . . . . . . . . . 131,446 118,940 114,381 11 4
% of net sales . . . . . . . . . . . . . . . . . . . . 6.2% 5.6% 5.4%
Impairment of goodwill and other assets . . 122,734 — 216,688 NM (100)
% of net sales . . . . . . . . . . . . . . . . . . . . 5.8% —% 10.3%
Restructuring charges (Credits), net. . . . . . (4,888) 13,811 43,704 (135) (68)
% of net sales . . . . . . . . . . . . . . . . . . . . (0.2)% 0.6% 2.1%
Total operating expenses . . . . . . . . . . . . . . $758,897 $651,883 $961,671 16 (32)
% of net sales . . . . . . . . . . . . . . . . . . . . 35.9% 30.6% 45.8%
NM—Not Meaningful.
The increase in total operating expenses during fiscal year 2015, compared to fiscal year 2014,
was primarily due to a goodwill impairment charge of $122.7 million relating to our video conferencing
reporting unit and $23.7 million in expense related to the Audit Committee’s Independent investigation
during fiscal 2015, partially offset by a restructuring credit of $4.9 million during fiscal year 2015 resulting
from partial lease termination of our Silicon Valley campus, which was previously vacated and under a
restructuring plan during fiscal year 2014, as opposed to a restructuring charge of $13.8 million during
fiscal year 2014.
The decrease in total operating expenses during fiscal year 2014, compared to fiscal year 2013,
was primarily due to the $216.7 million impairment of goodwill and other assets recorded in fiscal year
2013, combined with the restructuring plans initiated in fiscal year 2013, which reduced personnel-related
expenses in fiscal year 2014 as well as resulted in a $30.0 million decrease in restructuring expenses in
fiscal 2013.
Marketing and Selling
Marketing and selling expense consists of personnel and related overhead costs, corporate
and product marketing, promotions, advertising, trade shows, customer and technical support and
facilities costs.
During fiscal year 2015, marketing and selling expense remained flat compared to fiscal year 2014.
21
Annual Report Fiscal Year 2015