APC 2005 Annual Report Download - page 125
Download and view the complete annual report
Please find page 125 of the 2005 APC annual report below. You can navigate through the pages in the report by either clicking on the pages listed below, or by using the keyword search tool below to find specific information within the annual report.-
 1
1 -
2
-
3
-
4
-
5
-
6
-
7
-
8
-
9
-
10
-
11
-
12
-
13
-
14
-
15
-
16
-
17
-
18
-
19
-
20
-
21
-
22
-
23
-
24
-
25
-
26
-
27
-
28
-
29
-
30
-
31
-
32
-
33
-
34
-
35
-
36
-
37
-
38
-
39
-
40
-
41
-
42
-
43
-
44
-
45
-
46
-
47
-
48
-
49
-
50
-
51
-
52
-
53
-
54
-
55
-
56
-
57
-
58
-
59
-
60
-
61
-
62
-
63
-
64
-
65
-
66
-
67
-
68
-
69
-
70
-
71
-
72
-
73
-
74
-
75
-
76
-
77
-
78
-
79
-
80
-
81
-
82
-
83
-
84
-
85
-
86
-
87
-
88
-
89
-
90
-
91
-
92
-
93
-
94
-
95
-
96
-
97
-
98
-
99
-
100
-
101
-
102
-
103
-
104
-
105
-
106
-
107
-
108
-
109
-
110
-
111
-
112
-
113
-
114
-
 115
115 -
 116
116 -
 117
117 -
 118
118 -
 119
119 -
 120
120 -
 121
121 -
 122
122 -
 123
123 -
 124
124 -
 125
125 -
 126
126 -
 127
127 -
 128
128 -
 129
129 -
 130
130 -
 131
131 -
 132
132 -
 133
133 -
 134
134 -
 135
135 -
136
-
137
-
138
-
139
-
140
-
141
-
142
-
143
-
144
-
145
-
146
-
147
-
148
-
149
-
150
-
151
-
152
-
153
-
154
-
155
-
156
-
157
-
158
-
159
-
160
-
161
-
162
-
163
-
164
 |
 |

123
Consolidated Financial Statements
Assets
(in millions of euros)
Dec. 31, 2004 Dec. 31, 2003
Non-current assets:
Goodwill, net 4,077.7 3,512.8
Intangible assets, net 846.5 270.7
Property, plant and equipment, net 1,458.8 1,439.1
Investments:
Investments accounted for by the equity method 65.3 60.5
Investments, net 154.3 369.6
Other investments 288.1 585.4
Total investments 507.7 1,015.5
Other non-current assets 262.1 315.6
Total non-current assets 7,152.8 6,553.7
Current assets:
Inventories and work in process 1,369.7 1,124.1
Trade accounts receivable 2,135.7 1,781.3
Other accounts receivable and prepaid expenses 571.5 627.0
Deferred taxes 752.8 747.2
Cash and cash equivalents 1,062.8 3,087.5
Total current assets 5,892.5 7,367.1
Total assets 13,045.3 13,920.8
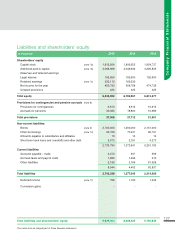
Liabilities and equity
(in millions of euros)
Dec. 31, 2004 Dec. 31, 2003
Shareholders' equity:
Capital stock 1,809.6 1,854.7
Additional paid-in capital 4,049.9 4,290.8
Retained earnings 2,023.8 1,724.6
Cumulative translation adjustment (308.2) (211.4)
Shareholders' equity (excluding minority interests) 7,575.1 7,658.7
Minority interests 69.0 74.9
Provisions for contingencies and charges:
Provisions for pensions 660.9 672.5
Provisions for contingencies 208.7 156.7
Total provisions for contingencies and charges 869.6 829.2
Long-term debt:
Ordinary and convertible bonds 1,200.0 1,200.0
Perpetual bonds 73.3 113.6
Other long-term debt 20.8 121.7
Total long-term debt: 1,294.1 1,435.3
Other long-term liabilities 104.4 40.5
Total long-term liabilities 1,398.5 1,475.8
Current liabilities:
Customer prepayments 69.8 56.2
Trade accounts payable 1,314.6 1,176.7
Accrued taxes and payroll costs 849.5 663.1
Deferred taxes 101.5 92.2
Other payables and accrued liabilities 543.4 641.0
Short-term liabilities: 2,878.8 2,629.2
Short-term debt 254.3 1,253.0
Total current liabilities 3,133.1 3,882.2
Total liabilities and shareholders' equity 13,045.3 13,920.8